Contents
- Opportunity Reports
- Configuring Opportunity Dashboard in Jacktrade – A Step by Step-by-Step Guide
- 1. Go to the Customers module
- 2. Click on ‘Opportunities’ from the left menu
- 3. Click on the ‘Dashboard’ icon from the top right bar
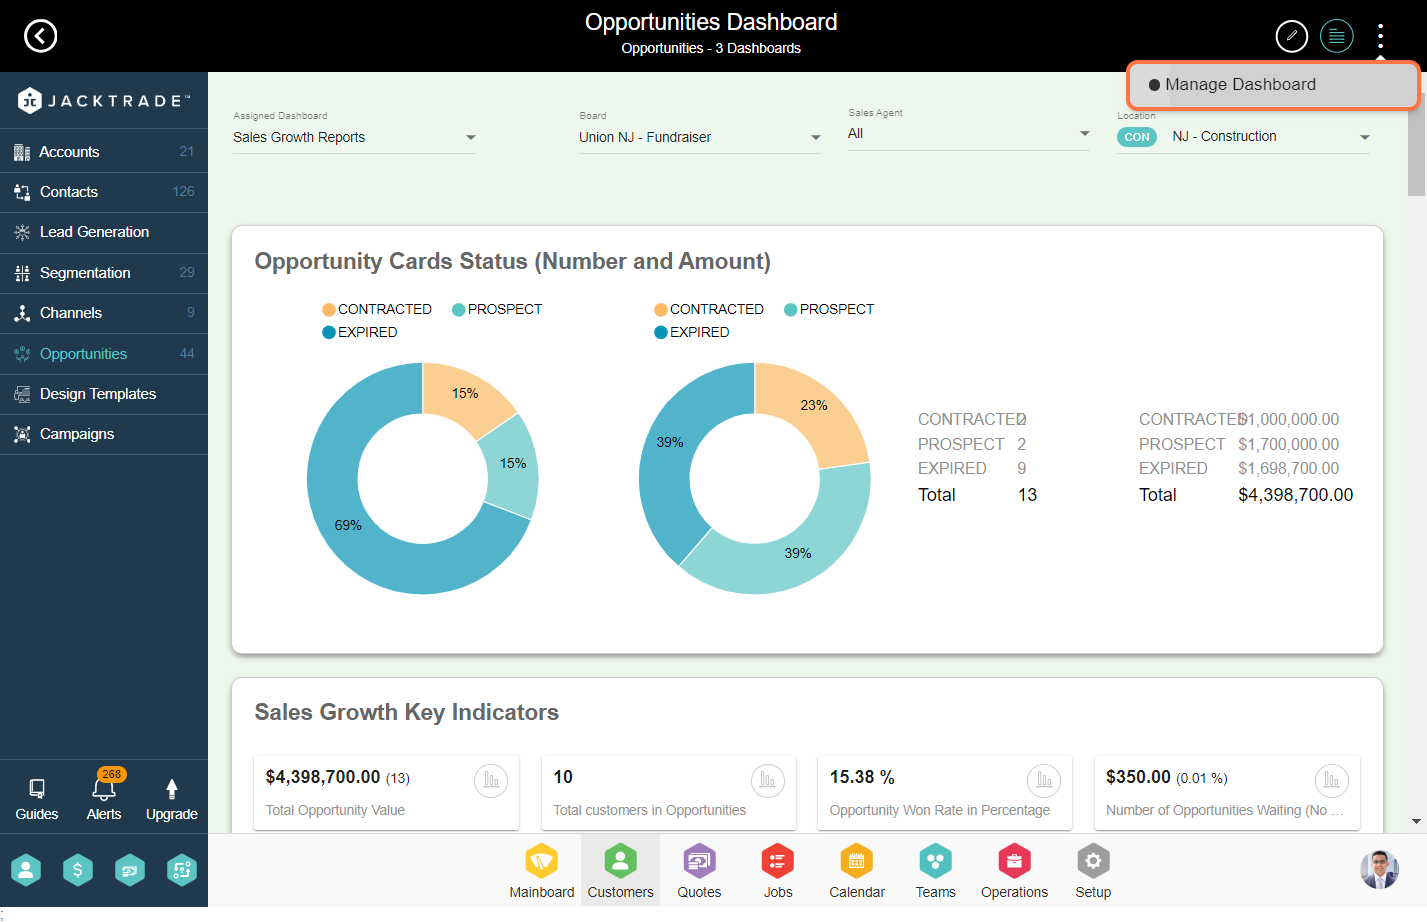
- 4. Click on ‘Options Menu’ (3 dots) and click on ‘Manage Dashboard’
- 5. To set up a new dashboard, click on the ‘Add’ icon
- 6. Enter the dashboard details like name, description, and attach the resource
- 7. To Insert the report click on ‘Add Report Block’
- 8. Select the category and chart type, you can select any one from the options
- 9. Click on ‘Add’ to include the report
- 10. Click on the ‘Edit’ icon and then click on the options menu(3 dots)
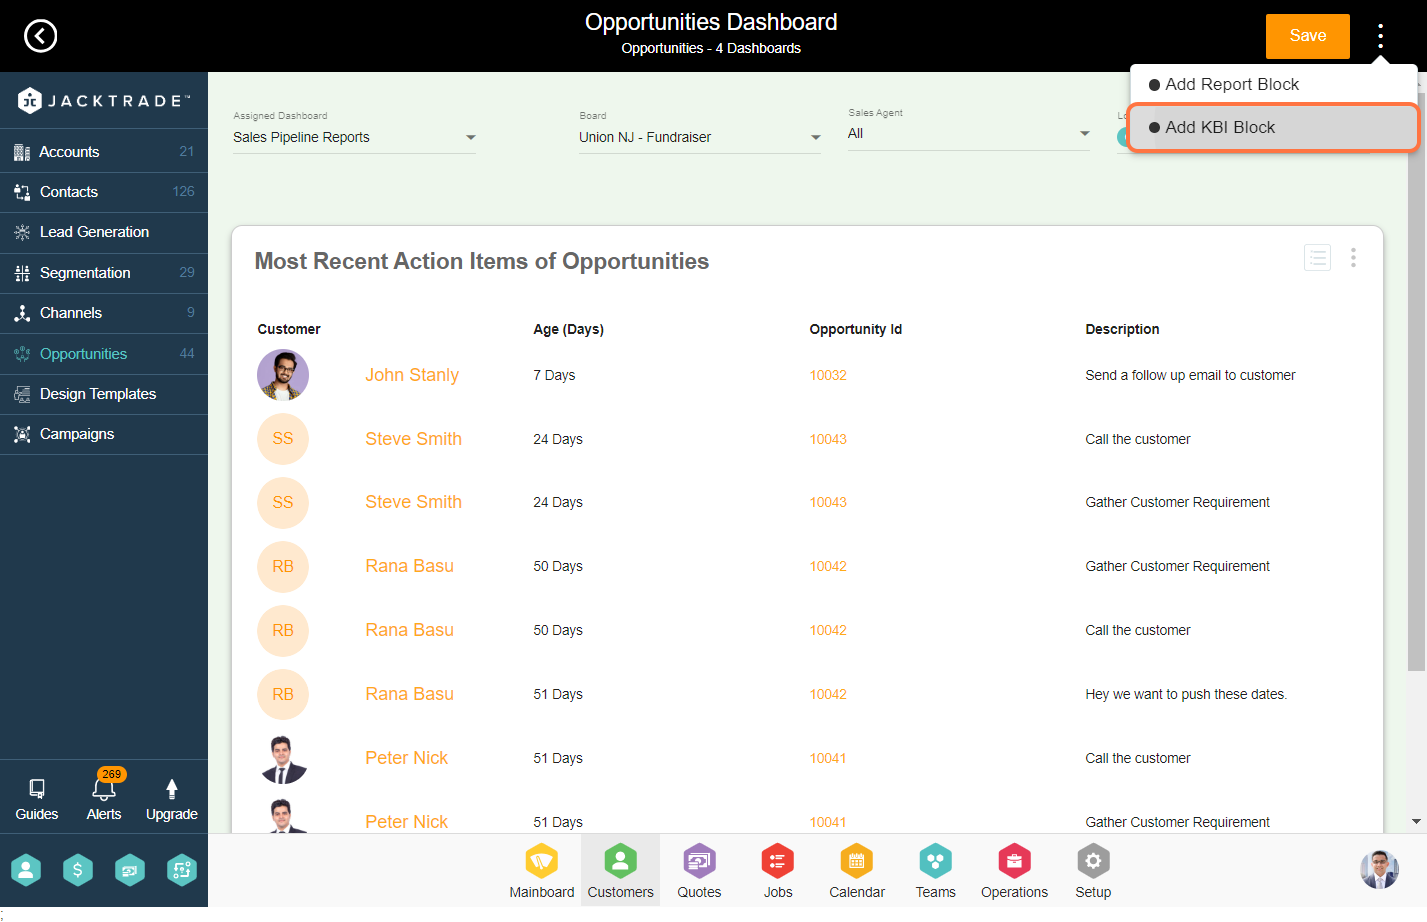
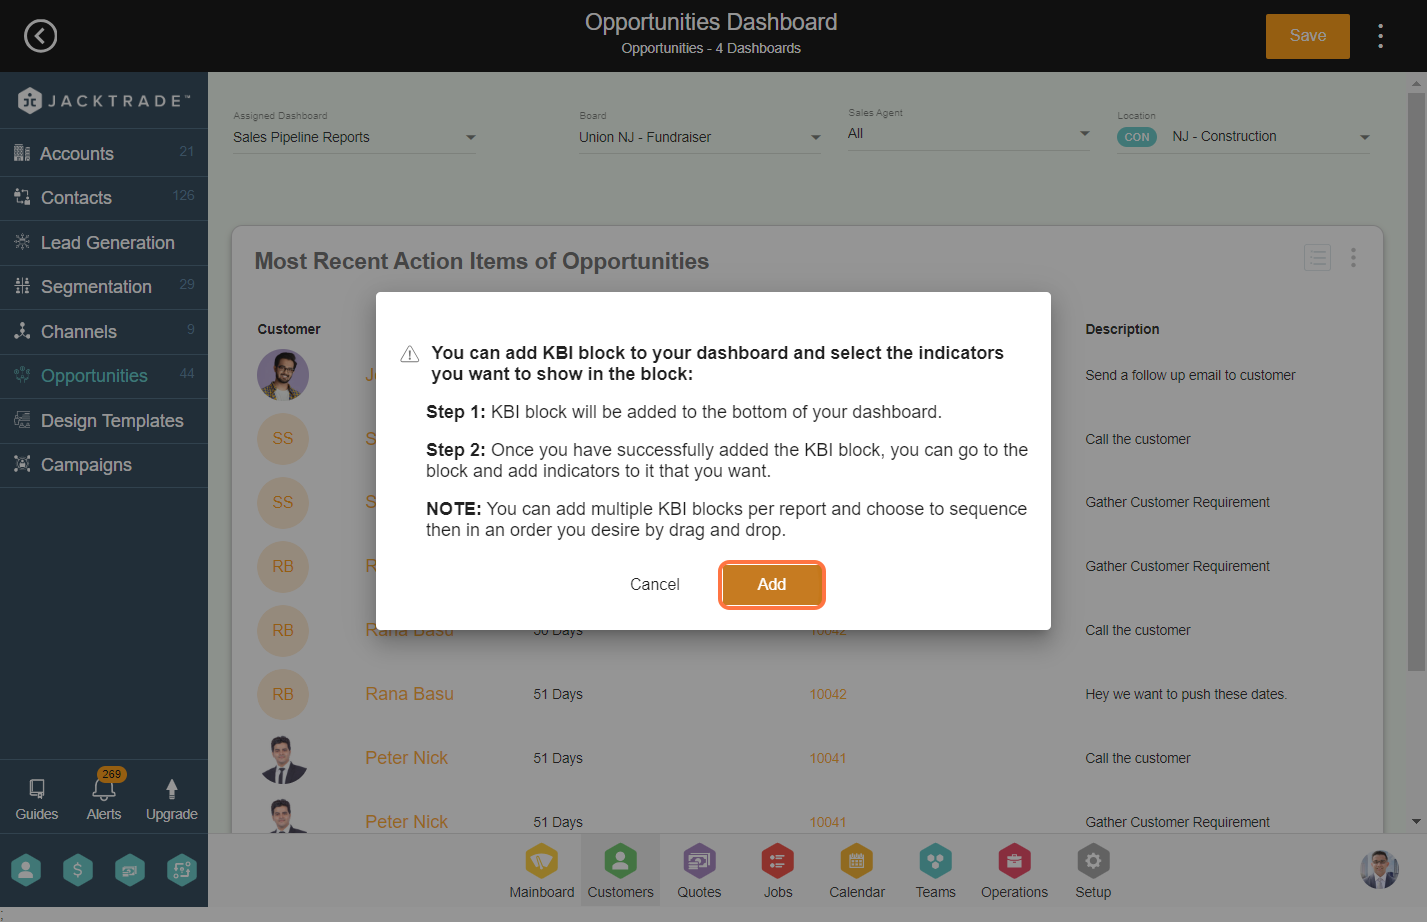
- 11. Click on ‘Add KBI Block’
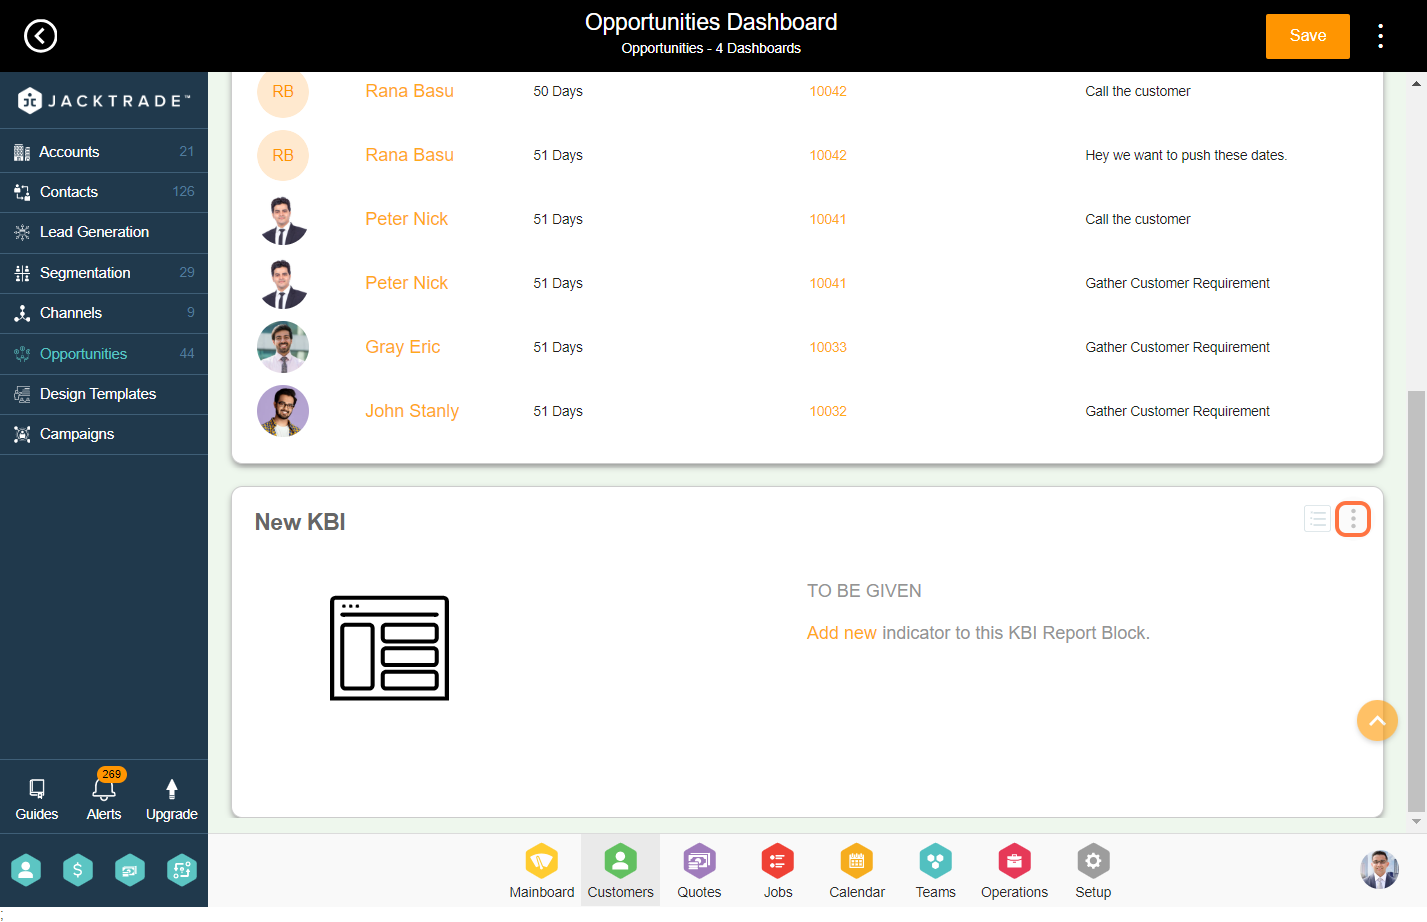
- 12. Within the KBI Block Section, click on the options menu(3 dots) and select ‘Block Settings’
- 13. Enter the block name, report time reference, and status if you want to include
- 14. Again click on options menu(3 dots) and click select ‘Manage Indicator’
- 15. Select the category and add the multiple KBI Blocks
Opportunity Reports
Opportunity reports can be configured as required by your business, and dashboards can be assigned per user.
The following customer reports are supported in Jacktrade.
Opportunity Reports – Key Business Indicators
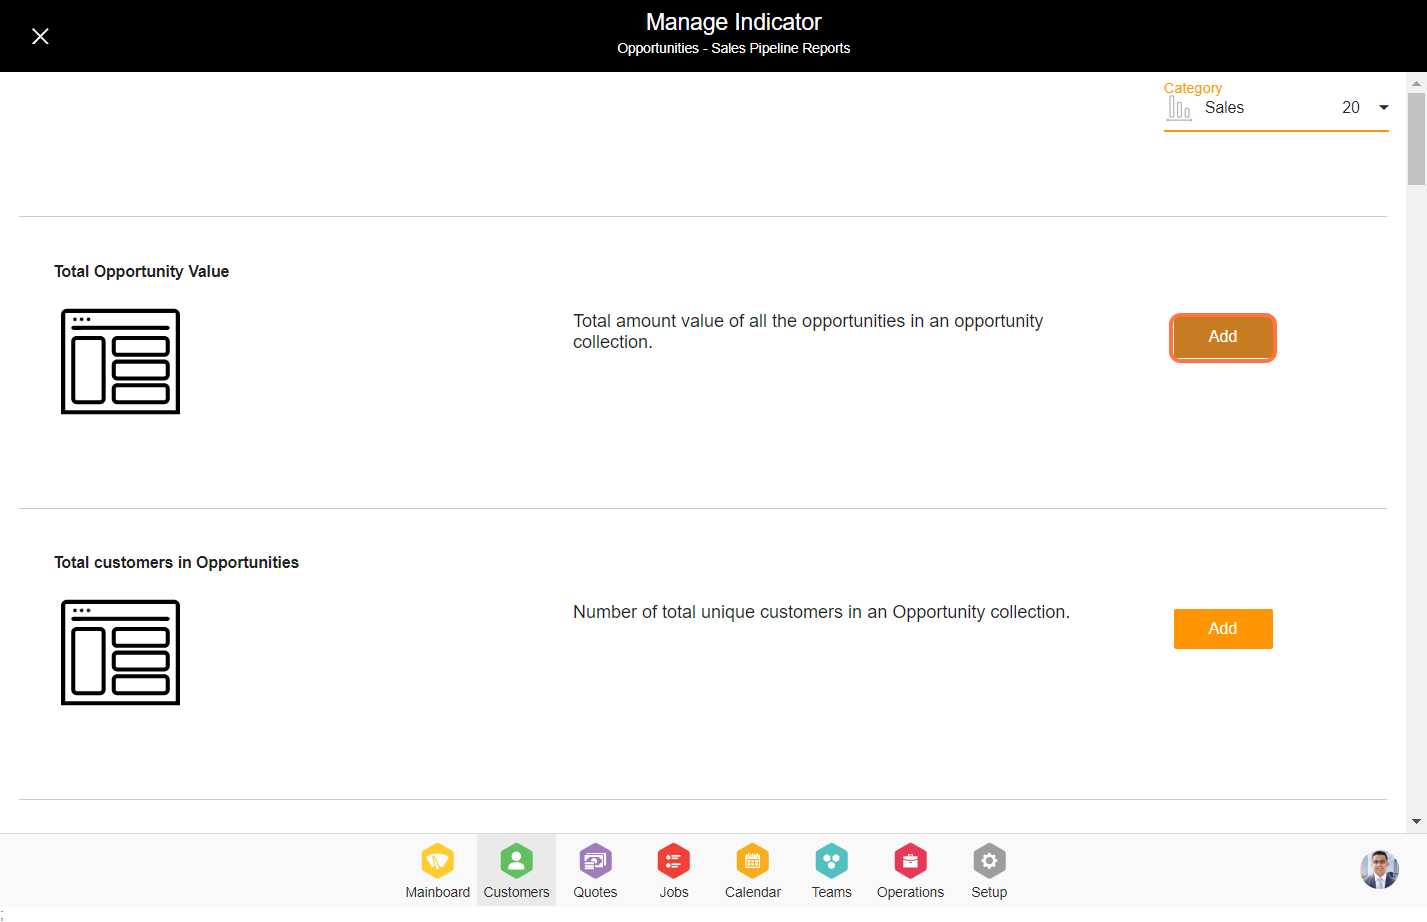
- Total Opportunity Value – Total amount value of all the opportunities in an opportunity collection.
- Total customers in Opportunities – Number of total unique customers in an Opportunity collection.
- Opportunity Won Rate in Percentage – Total Win Rate in the percentage of the entire opportunities involved in an Opportunity collection.
- Opportunities Loss in Percentage – Percentage of opportunity loss. Example: 100 opportunity cards with 20 losses will result in 20% value.
- Amount of Opportunity Won in Percentage – The number of total won cards in the Opportunity collection is shown in percentage and amount
- Number of Opportunities Waiting (No outcome) – Number of Opportunities Waiting (No outcome)
- Opportunities Won in Percentage – Percentage of opportunity won. Example: 100 opportunity cards with 40 won will result in 40%.
- Number of Opportunity Lost in Percentage – The number of total loss cards in Opportunity collection is shown in percentage and amount.
- Active Opportunity Cards – Number of total cards in Opportunity collection.
- Opportunity Conversion Rate In Days – Conversion rate is defined by the number of opportunities turned into Win in a number of days. Example 1: 100 opportunities 12 won, gives 12 days in conversion rate.
- Average Opportunity Life In Days – Opportunities Average Lifetime (In Days) – Number of total cards with No Outcome in Opportunity collection.
- Total Number of Action Items in Opportunities – Total number of action items in Opportunities in the active list in entire Opportunities.
- Total Number of Completed Action Items in Opportunities – Total number of completed action items in Opportunities in the active list in entire Opportunities
- Total Number of Action Items in Won Opportunities – Total number of action items in Opportunities in the active list based on the Opportunities card status Won
- Total Number of Action Items in Lost Opportunities – Total number of action items in Opportunities in the active list based on the Opportunities card status Loss
- Total Number of Starred Action Items in won Opportunities – Total number of stared action items in Opportunities in the active list based on the Opportunities card status Won
- Total Number of Starred Action Items in Lost Opportunities – Total number of stared action items in Opportunities in the active list based on the Opportunities card status Loss
- Total Number of Completed Action Items in won Opportunities – Total number of completed action items in Opportunities in the active list based on the Opportunities card status Won
- Total number of Completed Action Items in lost opportunities – Total number of completed action items in Opportunities in the active list based on the Opportunities card status Loss
- Total percentage of completed Action Items in Opportunities – Percentage of Opportunities completed. Example: 100 Action items with 20 completed will result in a 20% value.
Opportunity Reports – Lists
- Most Recent Action Items of Opportunities – Most recent action items in Opportunity added based on the created date in the active list in the entire Opportunity
- Most Aged Actions Items of Opportunities – Most aged action items in Opportunity are based on the age of an Opportunity from created date.
- Most Recent Action Items of Opportunities with resource attached – Most recent action items in Opportunity added based on the created date in the active list in the entire Opportunity
- Most Aged Actions Items of Opportunities with resource attached – Most aged action items in Opportunity based on the age of an Opportunity from created date.
- Most Recent starred Action Items of Opportunities – Most recent starred action items in Opportunity added based on created date.
- Most Aged starred Actions Items of Opportunities – Most aged starred action items in Opportunity based on the age of an Opportunity from created date.
- Most Recent completed Action Items of Opportunities – Most recently completed action items in Opportunity added based on created date.
- Most aged Action Items of Opportunities with reminders – Action items with the furthest reminder in Opportunity based on reminder date.
- Most recent Action Items of Opportunities without reminders – Most recent action items without reminders in Opportunity are based on the age of an Opportunity from created date.
- Most aged Action Items of Opportunities without reminders – Most aged action items without reminders in Opportunity are based on the age of an Opportunity from created date.
- Most Aged completed Actions Items of Opportunities – Most aged completed action items in Opportunity based on the age of an Opportunity from the created date.
- Most recent Action Items of Opportunities with reminders – Action items with the nearest reminder in Opportunity based on reminder date.
- Most Recent Opportunities – Most recent opportunities added based on created date.
- Most Aged Opportunities – Most aged opportunities are based on the age of an opportunity from the created date.
- Recently Lost Opportunities – Most recent lost opportunities are based on the most updated loss date (opportunity can be lost, won, and then lost again).
- Recently Won Opportunities – Most recently won opportunities based on the most updated won date (opportunity can be won, lost, and then won again).
- Waiting Opportunities with a status no outcome – Most recent opportunities that have No Outcome based on created date (opportunity can be won, lost, and then won again).
- Oldest Lost Opportunity – Oldest lost opportunities based on the most updated loss date (opportunity can be lost, won, and then lost again).
- Oldest Won Opportunity – Oldest won opportunities based on the most updated won date (opportunity can be won, lost, and then won again).
- Oldest Waiting Opportunities with a status of no outcome – Oldest opportunities that have status as no outcome based on created date (opportunity can be won, not won, and then won again).
- Highest Won Opportunities – Highest won opportunities based on the most updated won date (opportunity can be won, lost, and then won again).
- Lowest Won Opportunities – Lowest won opportunities based on the most updated won date (opportunity can be won, lost, and then won again).
- Highest Lost Opportunities – Highest lost opportunities based on the most updated loss date (opportunity can be won, lost, and then won again).
- Lowest Lost Opportunities – Lowest lost opportunities based on the most updated loss date (opportunity can be won, lost, and then won again).
- Archived Opportunities – Archived Opportunities list fetched using first with an oldest archived date.
- Canceled & Void Opportunities – Canceled or Void Opportunities list fetched using first with the oldest cancel or void date.
Opportunity Reports – Pie Chart
- Distribution of Opportunity Card-based Status – Distribution of cards based on opportunity card status
- Distribution of Opportunities based on salespersons – Distribution of cards among various salespeople for particular filters of location and boards.
- Distribution of Action Items based on status in active Opportunities – Distribution of action items among various states of action item for the particular filter of location
- Distribution of Action Items based on the due date in Opportunities – Distribution of action items for the particular filter of location based on the reminder.
- Distribution of Action Items based on resource assignment in Opportunities – Distribution of action items for the particular filter of location based on resource assignment.
- Action Item status for WON Cards of Opportunities – Distribution of action items among various states of action items for the particular filter of location. Labels are 1. A number of active action items. 2. Number of Stared active action items 3. The number of completed action items.
- Action Item status for LOST cards of Opportunities – Distribution of action items among various states of action items for the particular filter of location. Labels are 1. A number of active action items. 2. Number of Stared active action items 3. The number of completed action items.
Opportunity Reports – Twin Pie Chart
- Number of won opportunity cards VS Opportunity amount based on opportunity status – Opportunity Sales cards wins (Number and Amount of cards)
- Number of lost opportunity cards VS Opportunity amount based on opportunity status – Opportunity Sales cards losses (Number and Amount of cards)
- Number of Opportunity Cards VS Amount of cards based on Opportunity status – Opportunity cards Status (Number and Amount of cards per status)
- Total Sales Distribution – (Number and Amount) – Opportunity Sales cards Distribution (Number of cards) Opportunity Sales cards Distribution (Amount of cards)
- Distribution of won opportunity cards based on amount number of cards and amount – Opportunity Sales cards wins (Number of cards)Opportunity Sales cards wins (Amount of cards)
- Distribution of lost opportunity cards based on amount number of cards and amount – Opportunity Sales cards losses (Number of cards)Opportunity Sales cards losses (Amount of cards)
- Win and Loss Opportunities – Amount based on sales – Opportunity Sales cards won (Amount of cards) and Opportunity Sales cards lost (Amount of cards)
- Win and Loss Opportunities – Number based on sales – Opportunity Sales cards won (Number of cards) and Opportunity Sales cards lost (Number of cards)
Configuring Opportunity Dashboard in Jacktrade – A Step by Step-by-Step Guide
1. Go to the Customers module
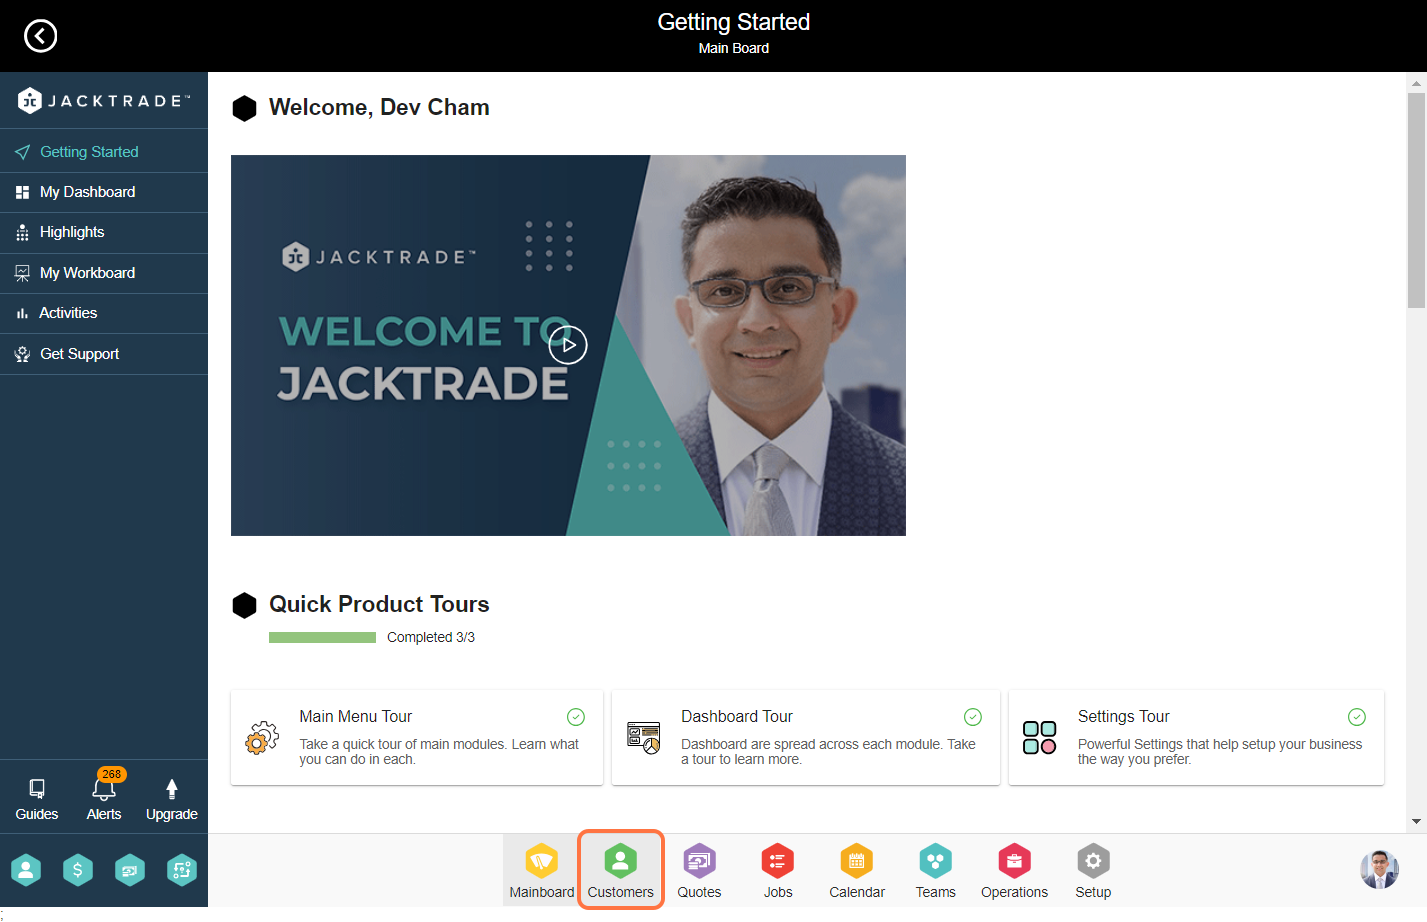

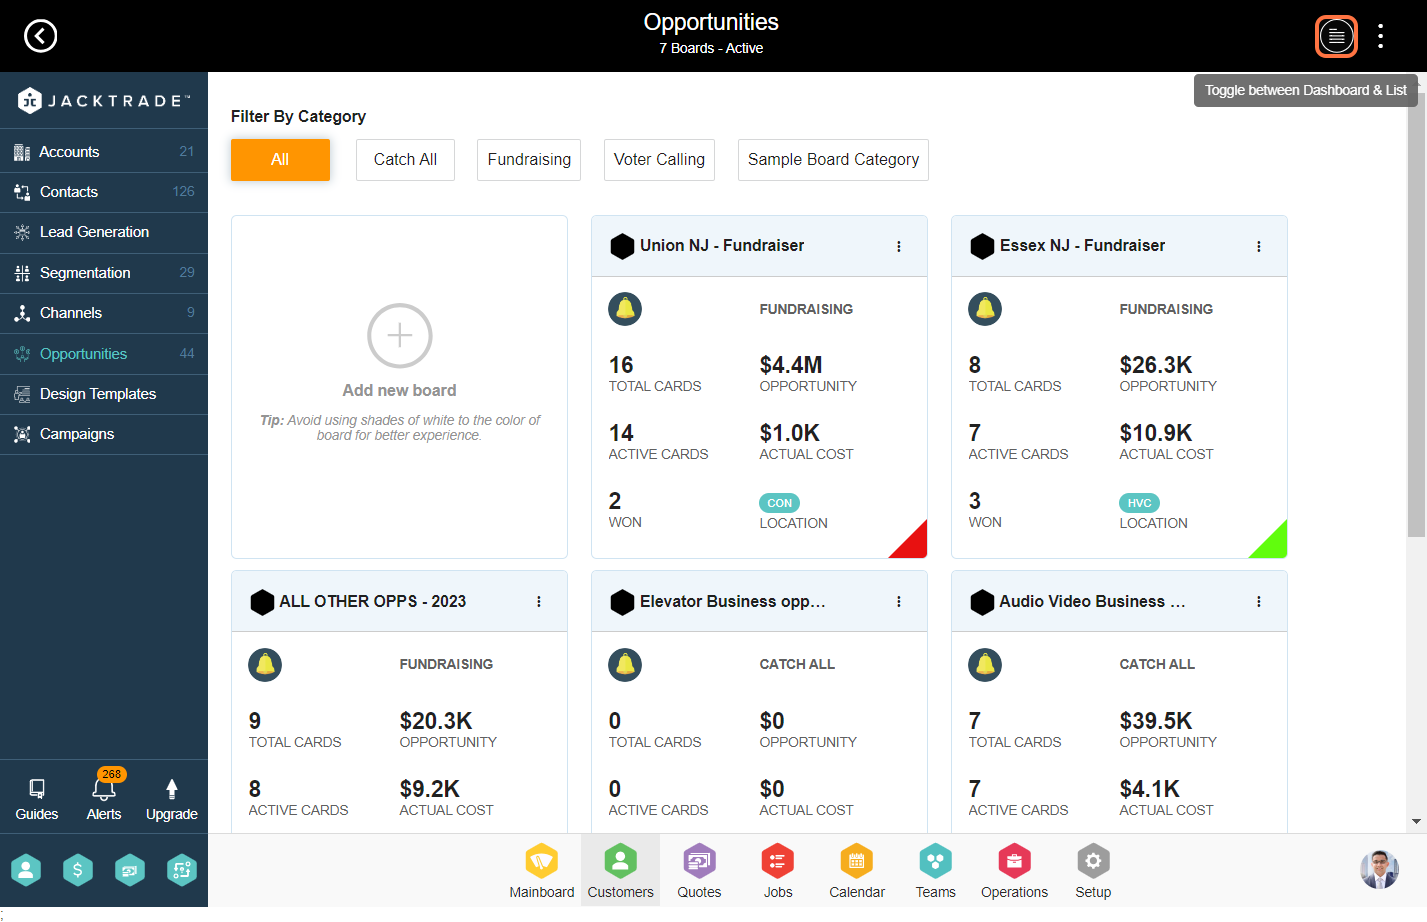
3. Click on the ‘Dashboard’ icon from the top right bar
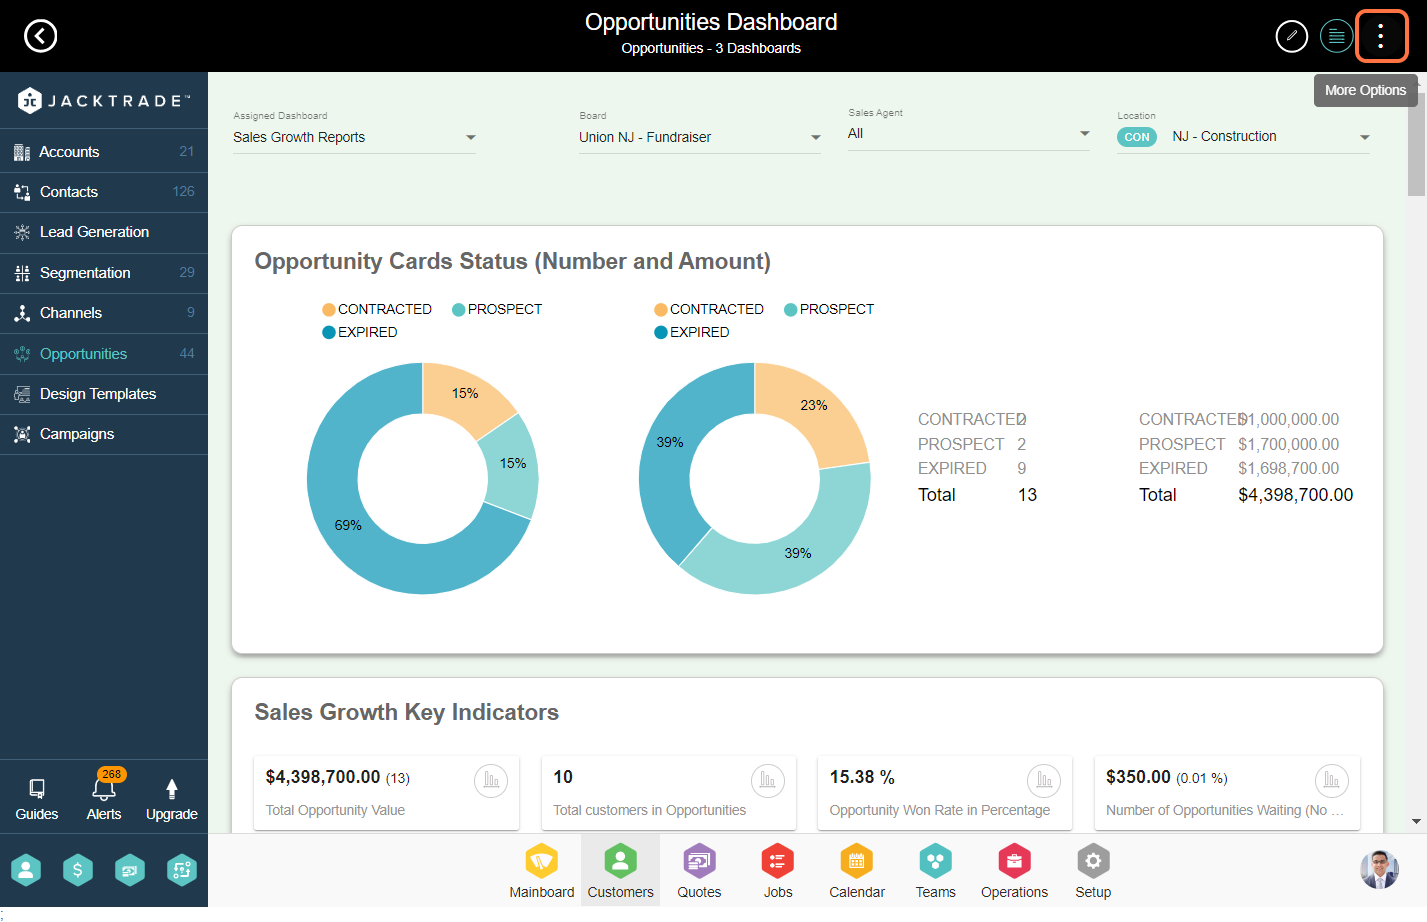
4. Click on ‘Options Menu’ (3 dots) and click on ‘Manage Dashboard’
5. To set up a new dashboard, click on the ‘Add’ icon
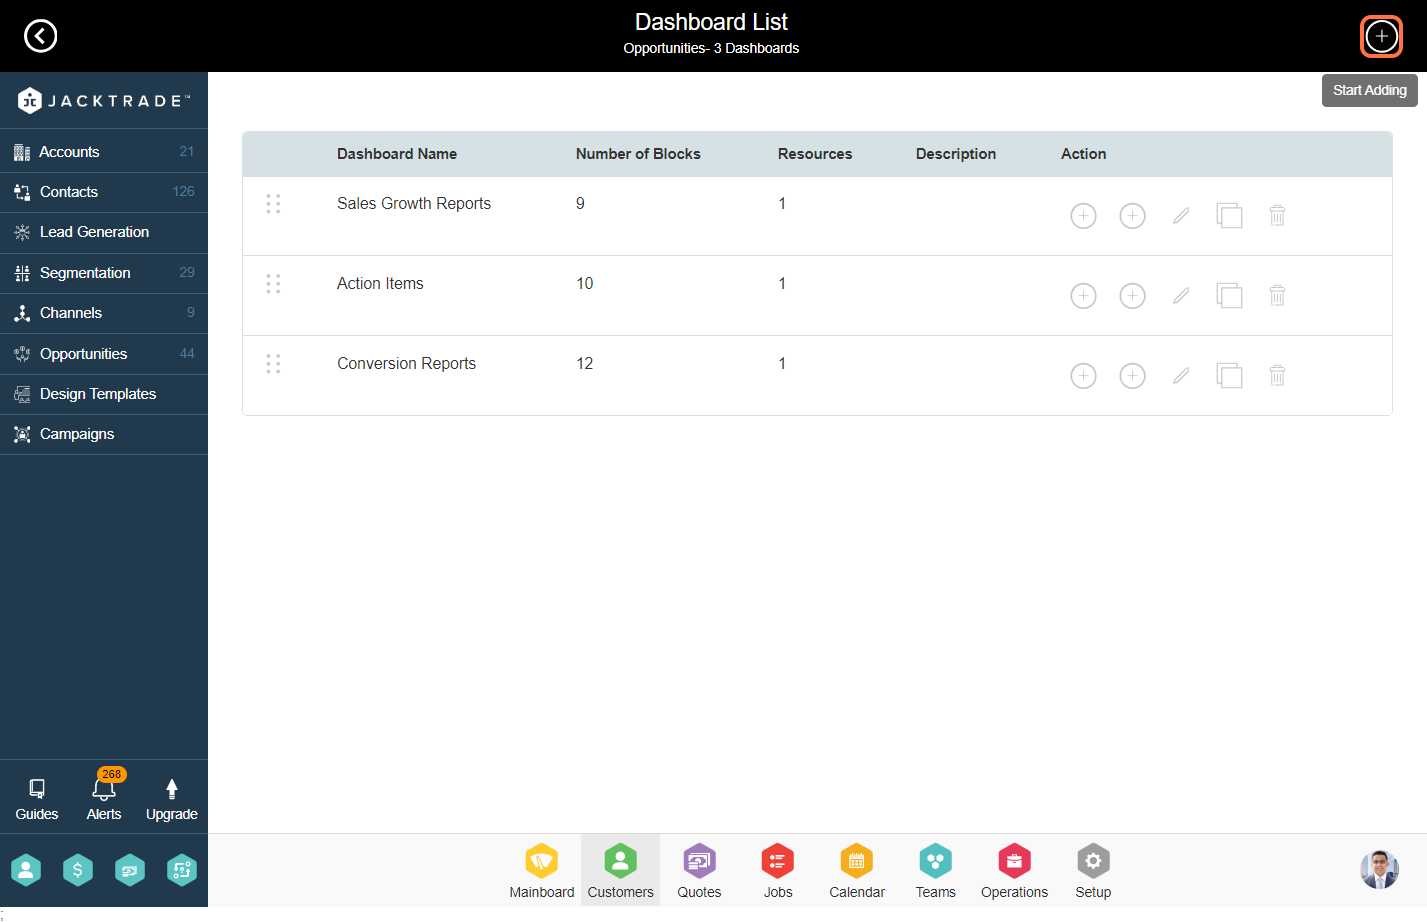
6. Enter the dashboard details like name, description, and attach the resource

7. To Insert the report click on ‘Add Report Block’
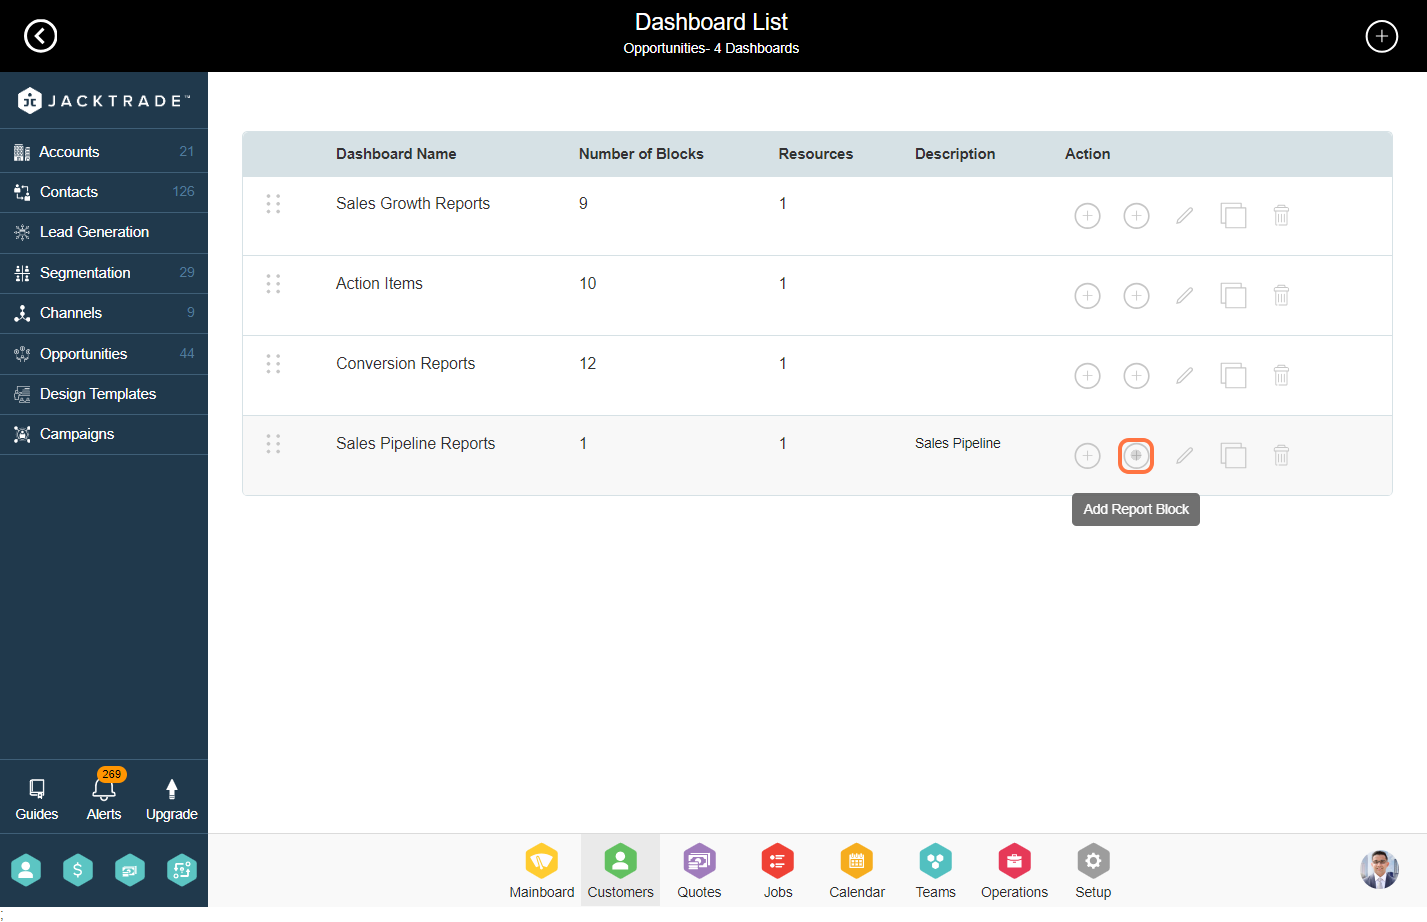
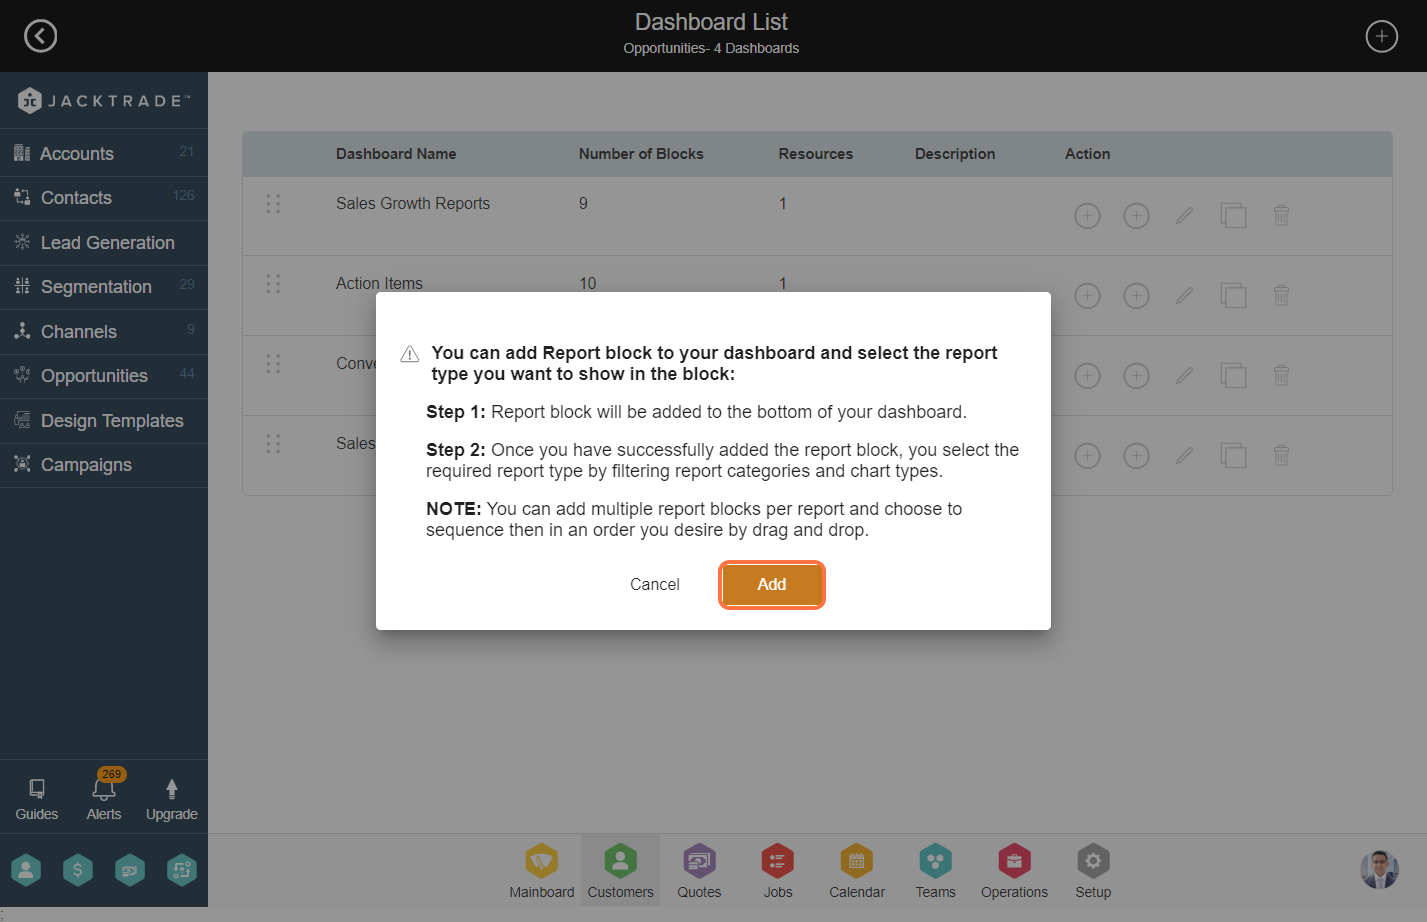
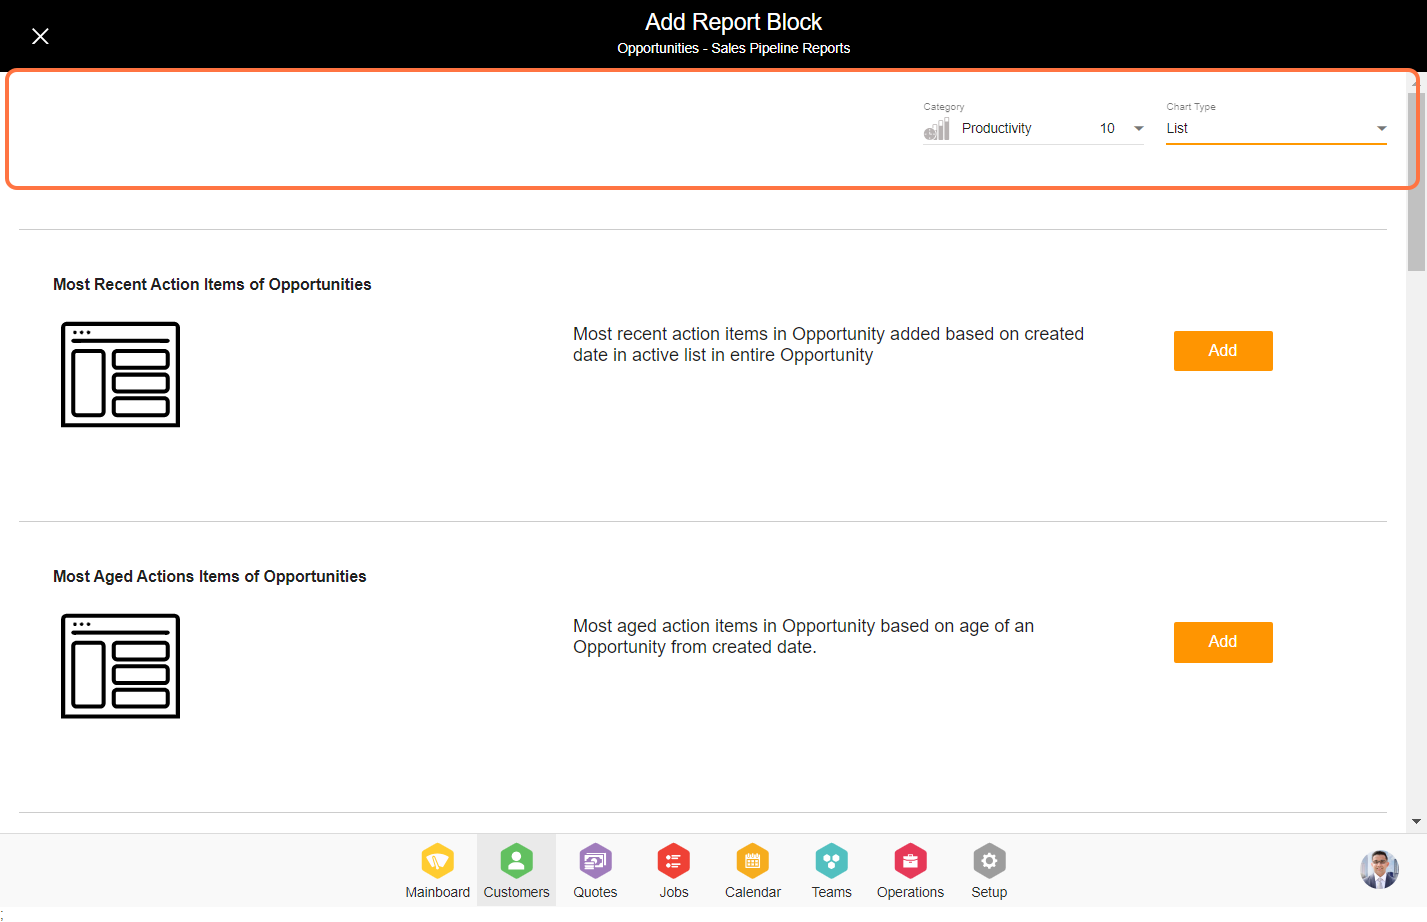
8. Select the category and chart type, you can select any one from the options
Category consists of – Productivity, Progress, Relationship, Sales
Chart Type consists of – Bar Chart, List, Pie Chart, Stack Bar Chart, Trend Chart, Twin Pie Chart
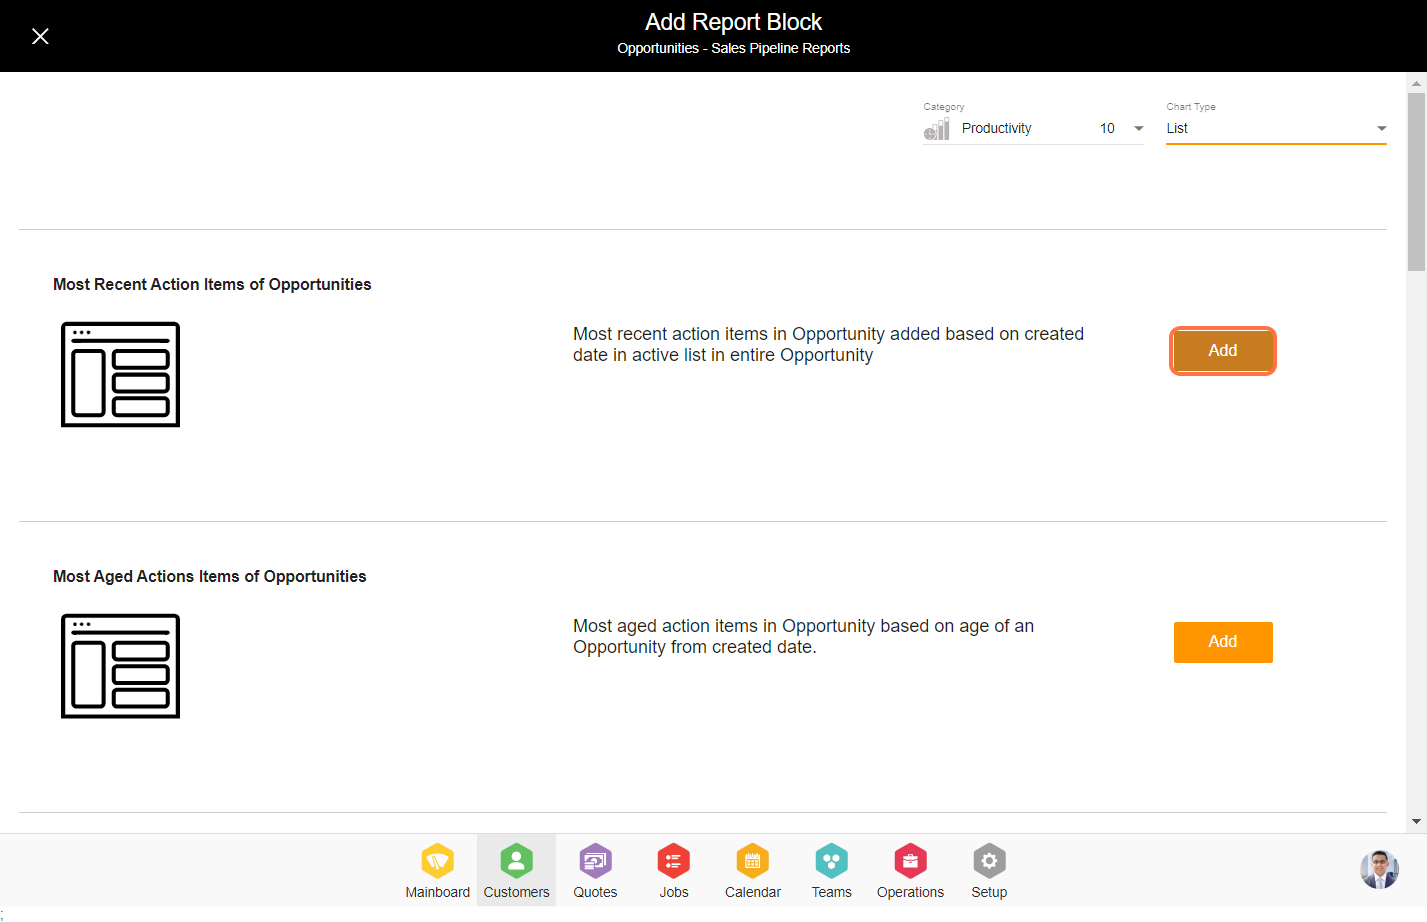
9. Click on ‘Add’ to include the report
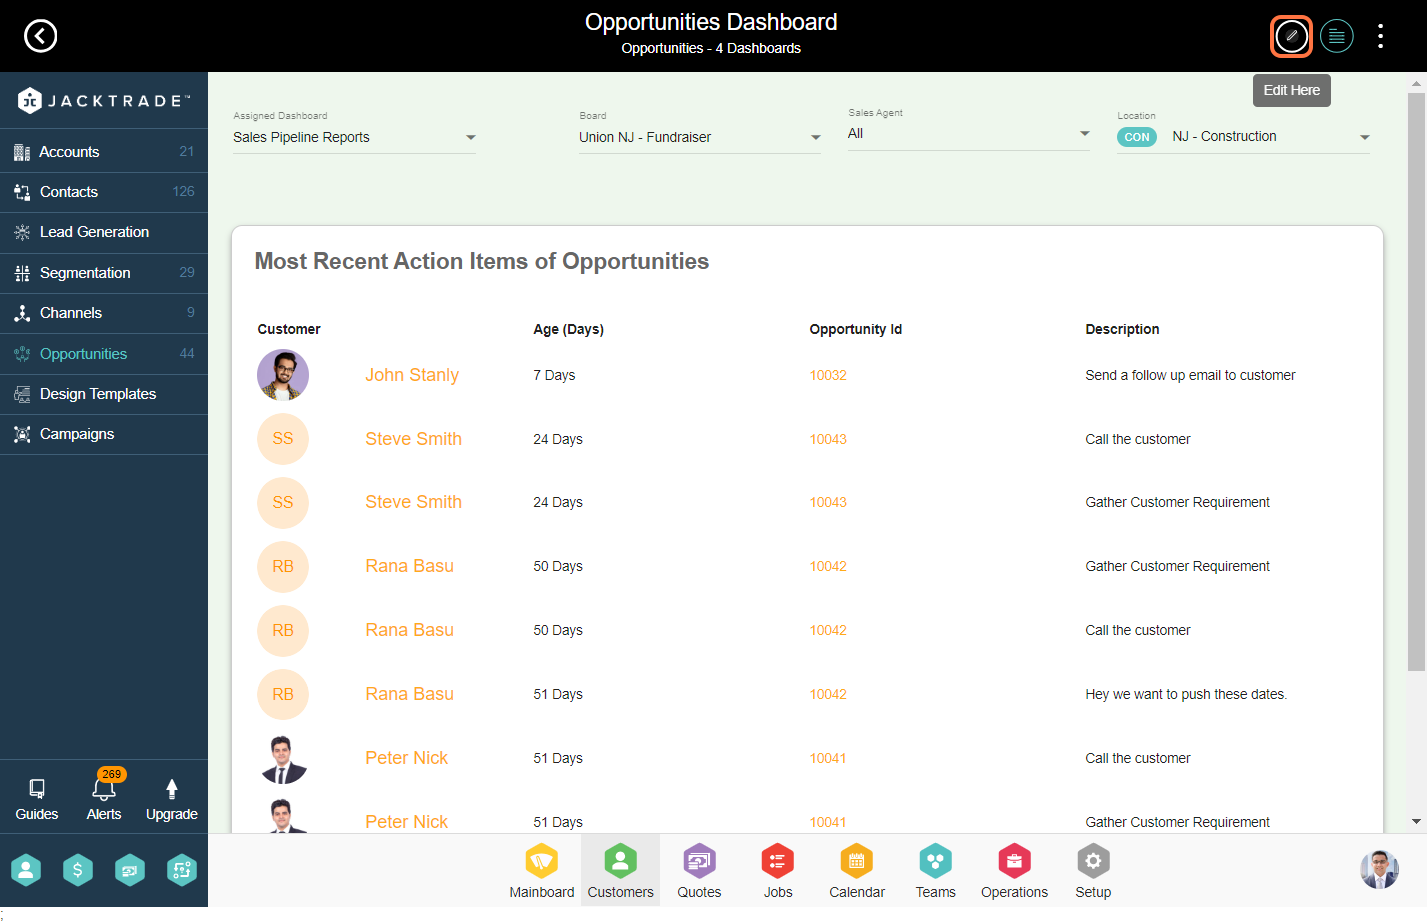
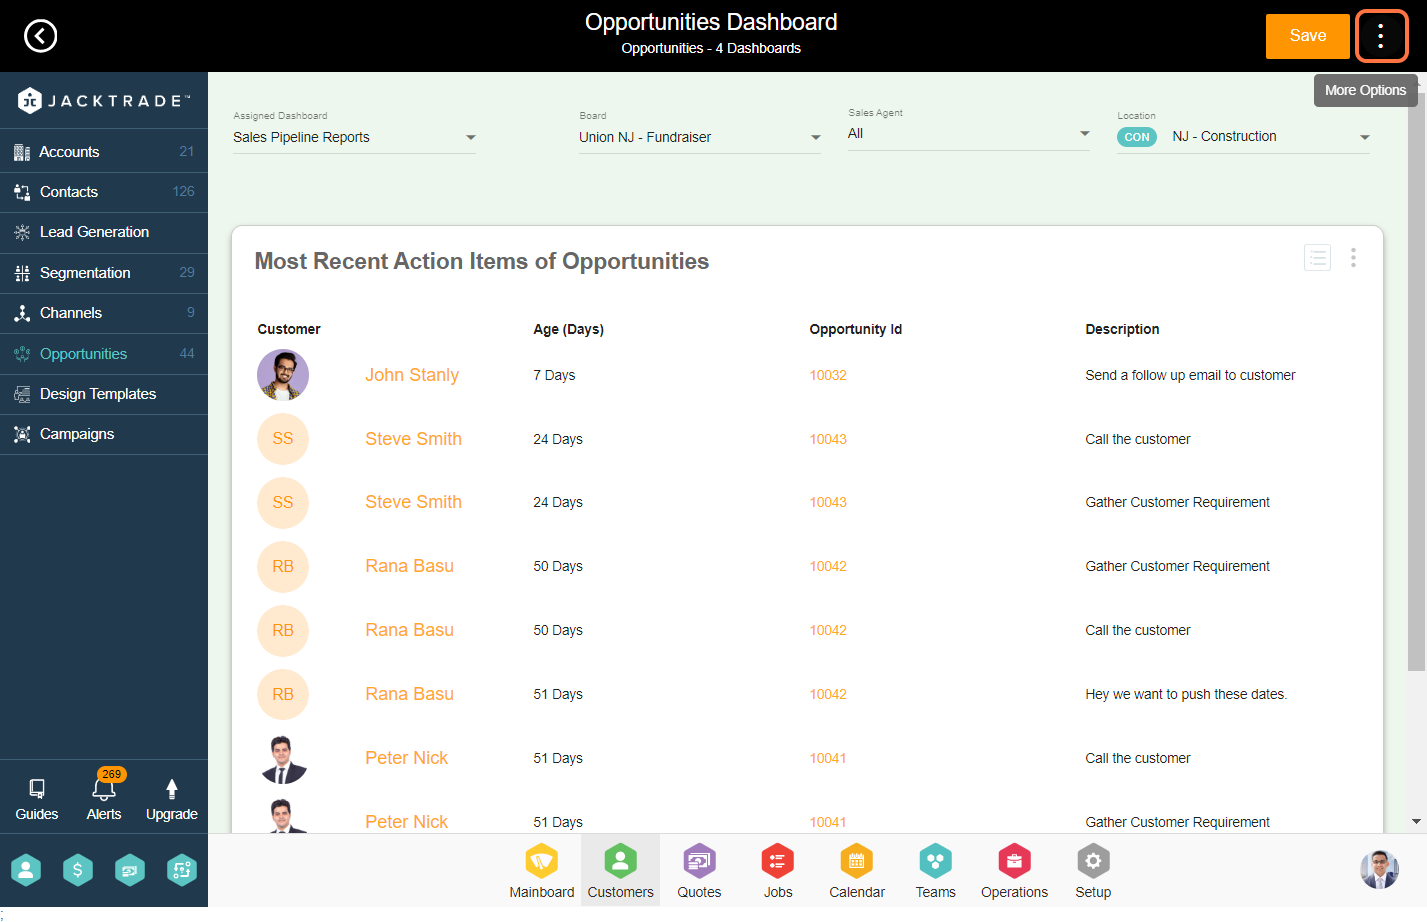
11. Click on ‘Add KBI Block’
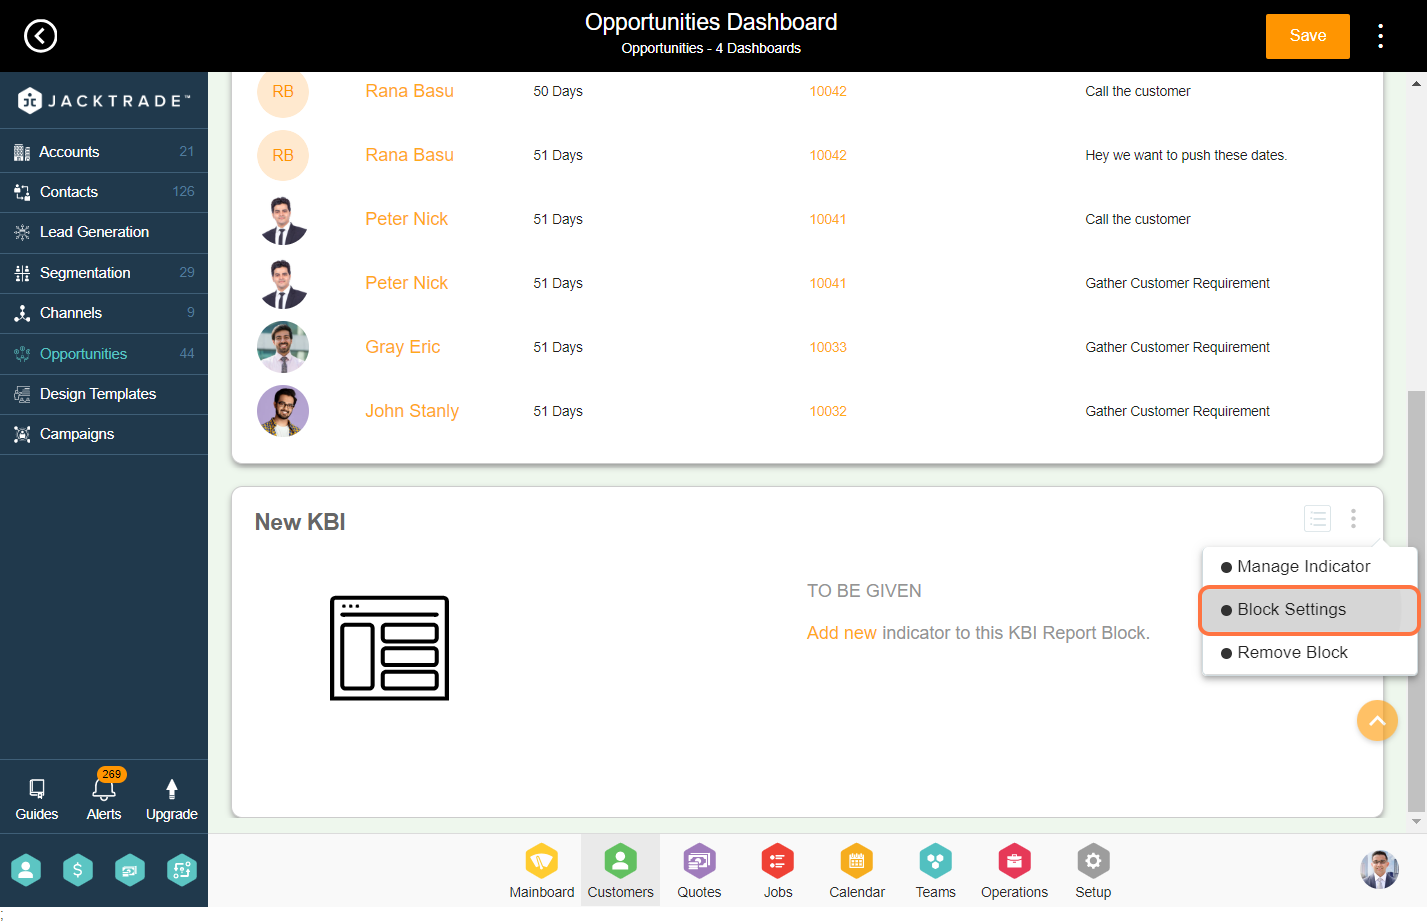
13. Enter the block name, report time reference, and status if you want to include

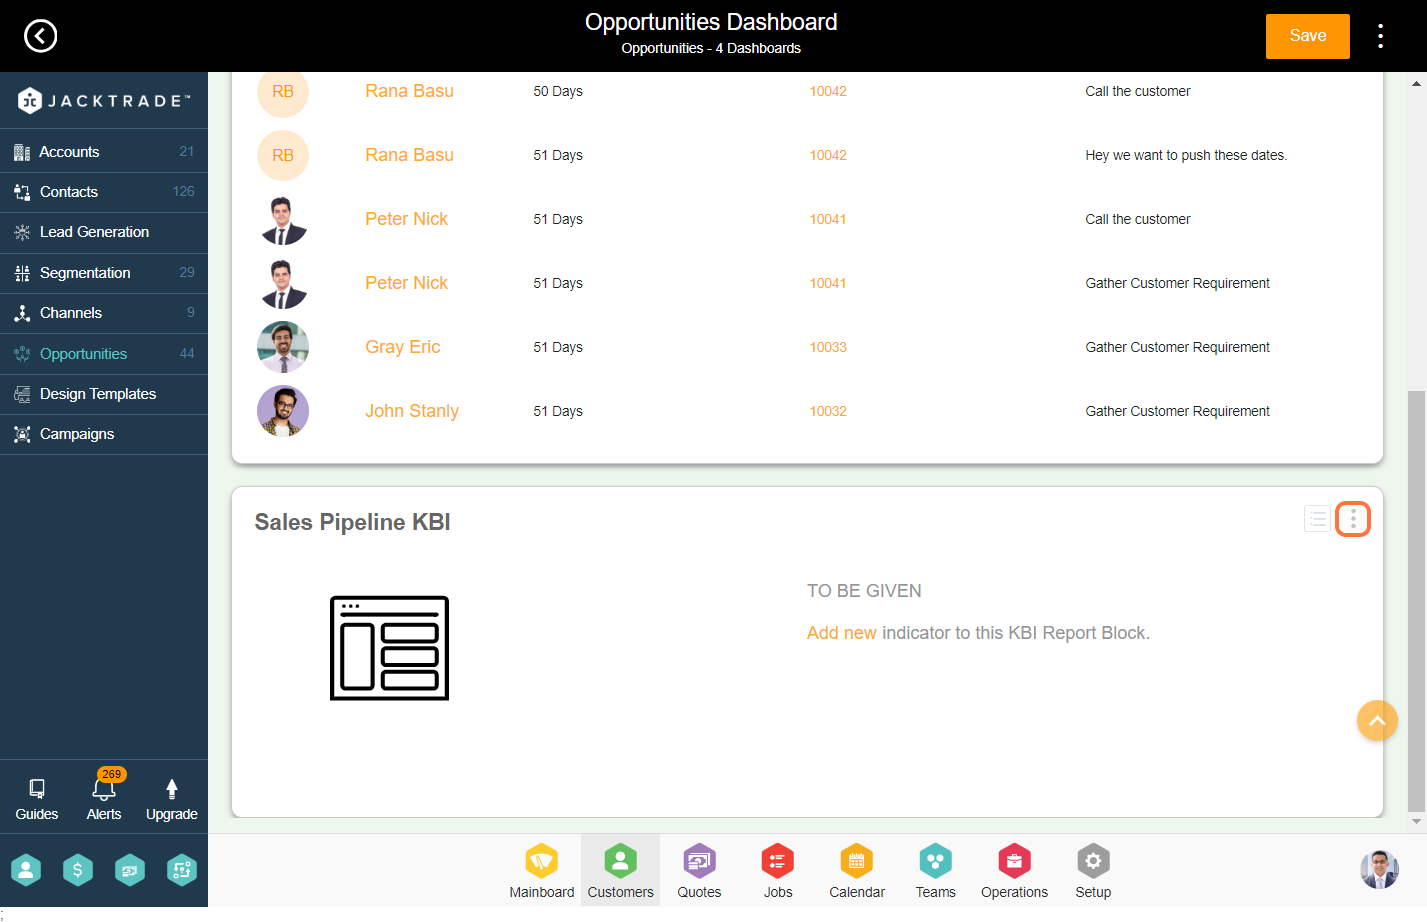
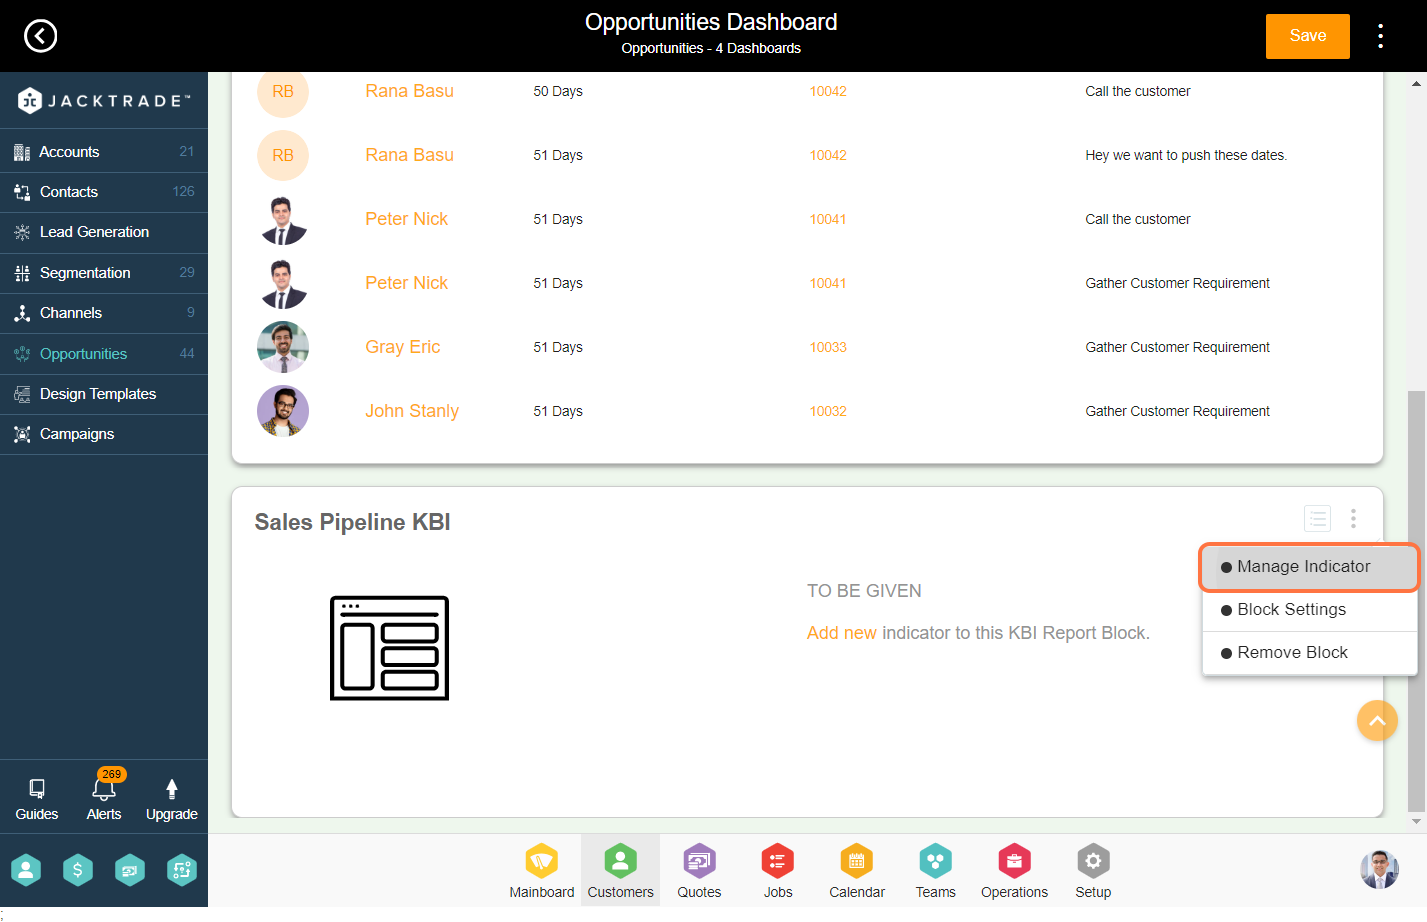
15. Select the category and add the multiple KBI Blocks
