
Application Main Board
Getting Started
Getting started is the place that walks you through the application and helps you set up your business correctly. It consists of product tours and implementation videos. This page will be updated regularly with new features and product tours to help your onboarding process.
It is highly recommended that users go through the implementation videos and product tours at least once before they start using the application.
Quick Product Tours
There are three tours for users here that will help you understand the navigation in the application. Here are the three tours -
- Main Menu Tour - This is a quick tour of the main modules at the bottom of the application. Here you can learn what you can do in each of the modules.
- Dashboard Tour - Dashboards are spread across many modules like Quotes, Jobs, Customers, and Opportunities. This tour helps you understand how to access and add dashboards.
- Settings Tour - The powerful settings module in Jacktrade helps you set up your business. With this tour, you can learn what you can do with the settings module.
Introduction
Jacktrade provides an ability for businesses to set up dashboards as per their business needs. Multiple dashboards can be configured and shared with your team members. Under the dashboards, you can add different types of reports like KBI’s, lists, pie charts, trend charts, etc. All the business needs to do is, pick the reports from the pre-existing list of reports and add them to your dashboards and you are up and running with the reports.
Dashboards can be configured for the following modules now - Mainboard, Quotes, Quotes, Customers, and Opportunities. We shall soon have reports and dashboards for other modules like inventory, procurement, etc.
Configuring Dashboards
Toggle between list and dashboards
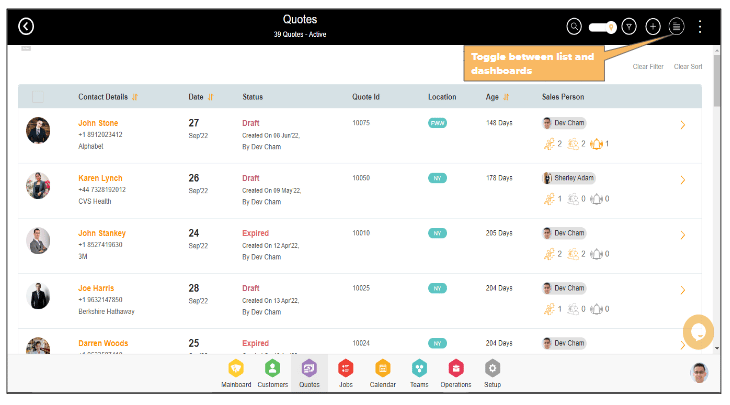
Users can toggle between the lists and dashboards with just one click. This gives the ability for users to quickly switch between the function lists and the dashboard reports. This functionality is available for the following dashboards - Quotes, Quotes, Customers, and Opportunities.
Adding Dashboards
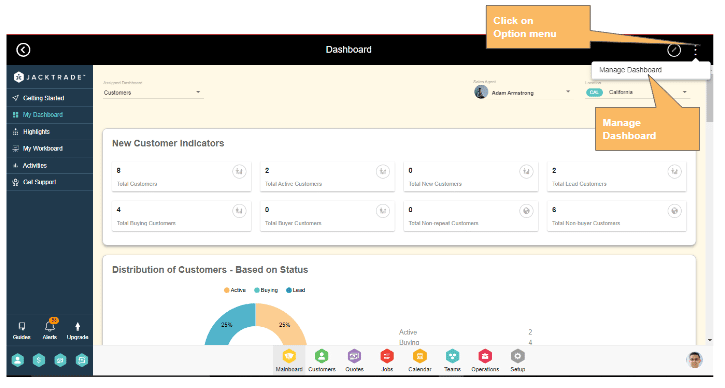
Businesses can choose to set up one or more dashboards. The maximum number of dashboards that businesses can set depends on their subscription plan. On the 3 three dots on the top right, click on ‘Manage Dashboards’. This will give you a list of existing dashboards in the business. Initially, you will not have any dashboards configured so it will show you an empty list
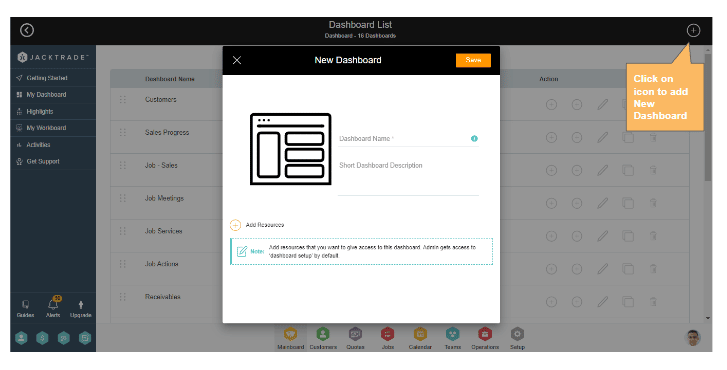
On the top right, click on the plus icon which will open a pop-up. On the pop-up, you can set up the dashboard name, and description and assign resources which whom you want to share this dashboard.
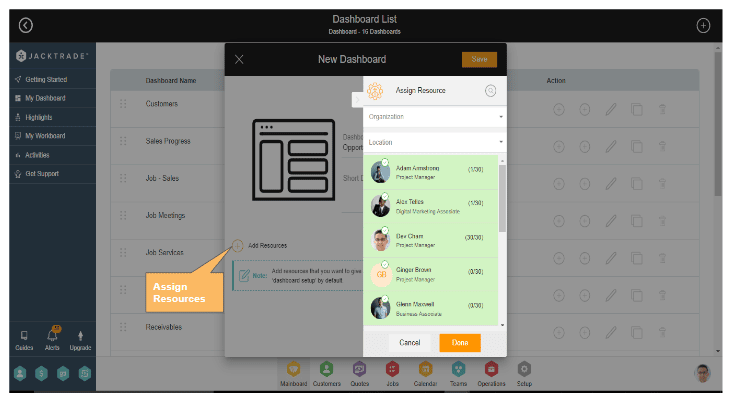
Assigning Resources
One or many resources can be assigned to a dashboard. Resources to whom the dashboard is assigned can see the dashboards and the reports set within it. This gives the ability for businesses to set specific reports and share it with their team. Users with administrator permissions will get access to ‘Dashboard setup’ by default.
P.S - if you are adding a dashboard, you need to assign it to yourself from the resource assignment in order for you to see the dashboard in your list.
Adding Report Blocks
Jacktrade supports report blocks and KBI blocks. Businesses can choose to add report blocks and KBI blocks to the dashboards. Multiple blocks can be added to one dashboard and reports can be added inside each of the blocks. Under report blocks, you can add one report whereas under KBI block you can add one or more KBI’s.
Report blocks can be added to the dashboards from two places -
- From the dashboard list.
From manage dashboards, you will see the list of the dashboards added to the business. Under the actions, you can choose to quickly add a report block to the desired dashboard.
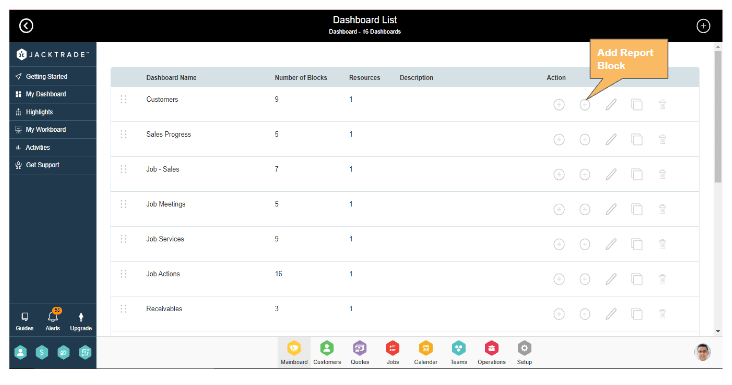
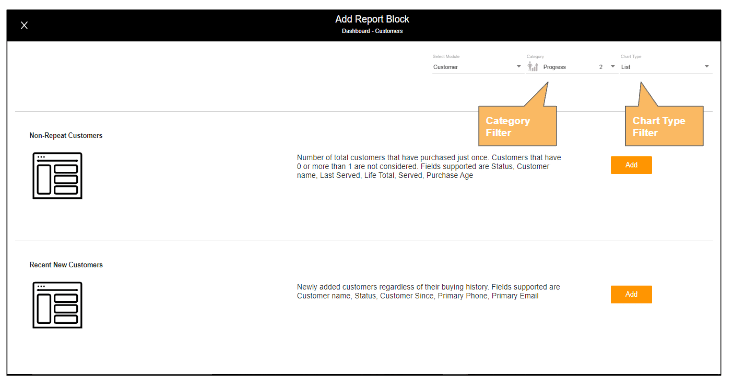
Once the report block is added to the dashboard, you can filter the reports with category and chart type. You can then choose to add the desired report to the block.
2. From the dashboard itself.
From the dashboards, you need to edit the dashboard. This gives you the ability to add, update and delete the reports under the dashboard. On the three dots on the top right, you can find options to add report blocks and KBI blocks. By default, the blocks added are added at the bottom of the dashboard.
Once the report block is added to the dashboard, you can filter the reports with category and chart type. You can then choose to add the desired report to the block.
Adding KBI Blocks
KBI blocks can be added to the dashboards from two places just like the report blocks -
- From the dashboard list.
From manage dashboards, you will see the list of the dashboards added in the business. Under the actions, you can choose to quickly add a KBI block to the desired dashboard.
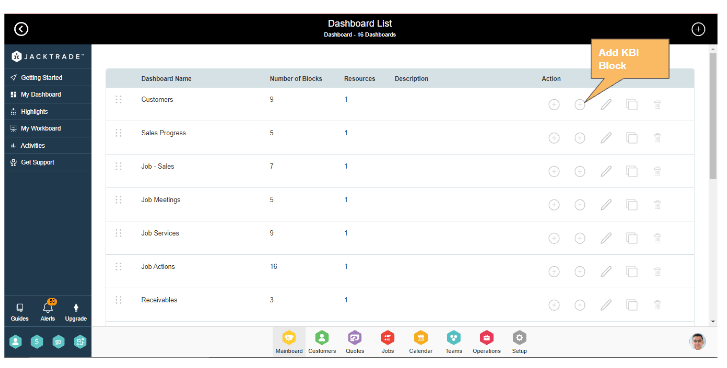
Once the KBI block is added to the dashboard, you can filter the reports with category. You can then choose to add the desired KBI’s to the block. You can add one or more indicators to one KBI block.
2. From the dashboard itself.
From the dashboards, you need to edit the dashboard. This gives you the ability to add, update and delete the reports under the dashboard. On the three dots on the top right, you can find options to add report blocks and KBI blocks. By default, the blocks added are added at the bottom of the dashboard.
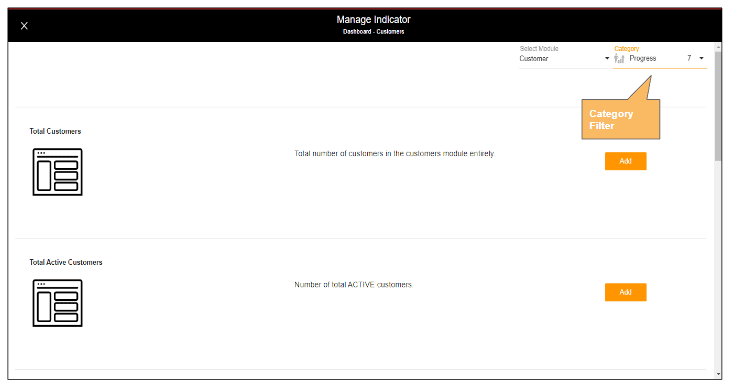
Once the KBI block is added to the dashboard, you can click on the ‘Add New’ indicator on the KBI block added.
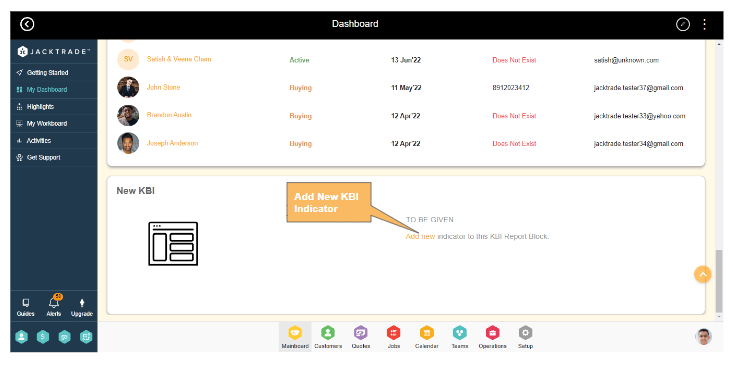
Here you filter the indicators based on categories and choose to add the indicators required into the block.
Refer to the image from the above method of adding KBI Blocks.