Highlights
Business highlights help you have a quick view of the business activities. You can quickly know the customer statuses, sales growth, and what your sales pipeline looks like. This is pre-set data for the business and not configurable by the business. As you start working on the platform, the data will start to populate here based on the activities.
Business highlights consist of the following things -
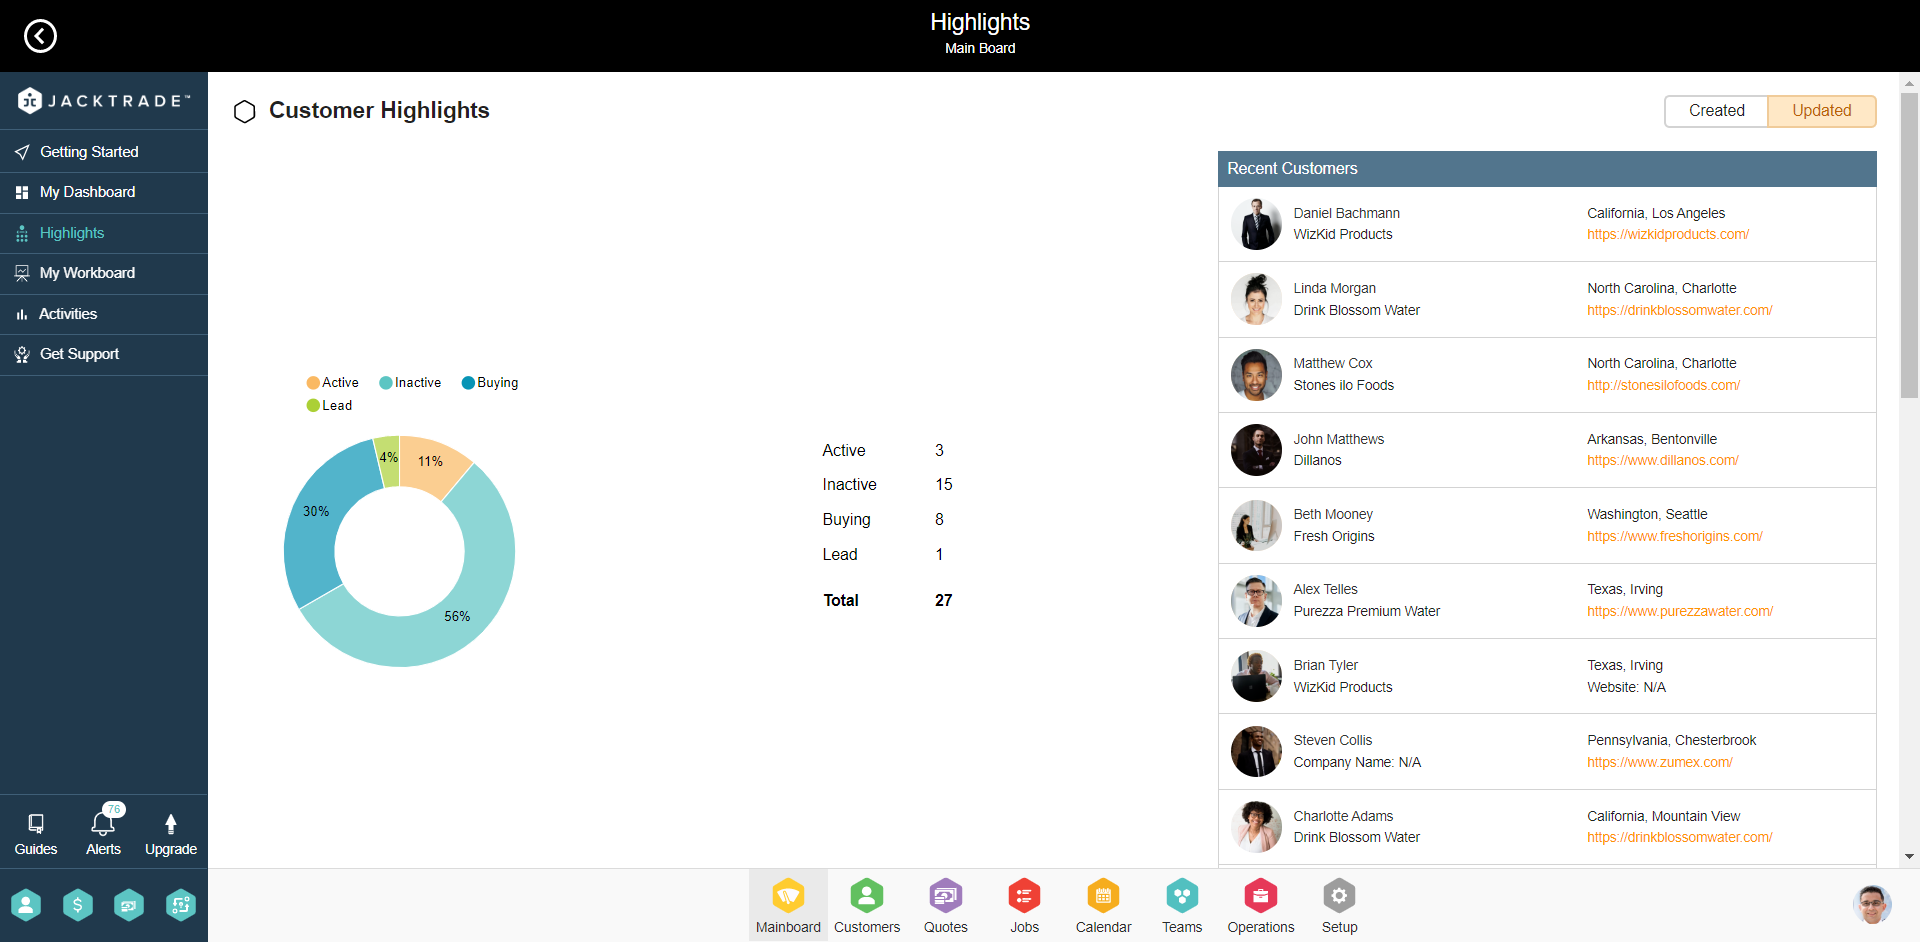
Customer Highlights
Customer highlights show how many customers are there currently in your business and a pie chart representing the number of customers with respect to the statuses. Statuses include the following -
- Inactive
- Active
- New
- Buying
- Lead
It also shows a list of the top 10 recently updated and created customers in the business. This list shows the following data of the customers -
- Customer name
- Company name
- Location
- Website.
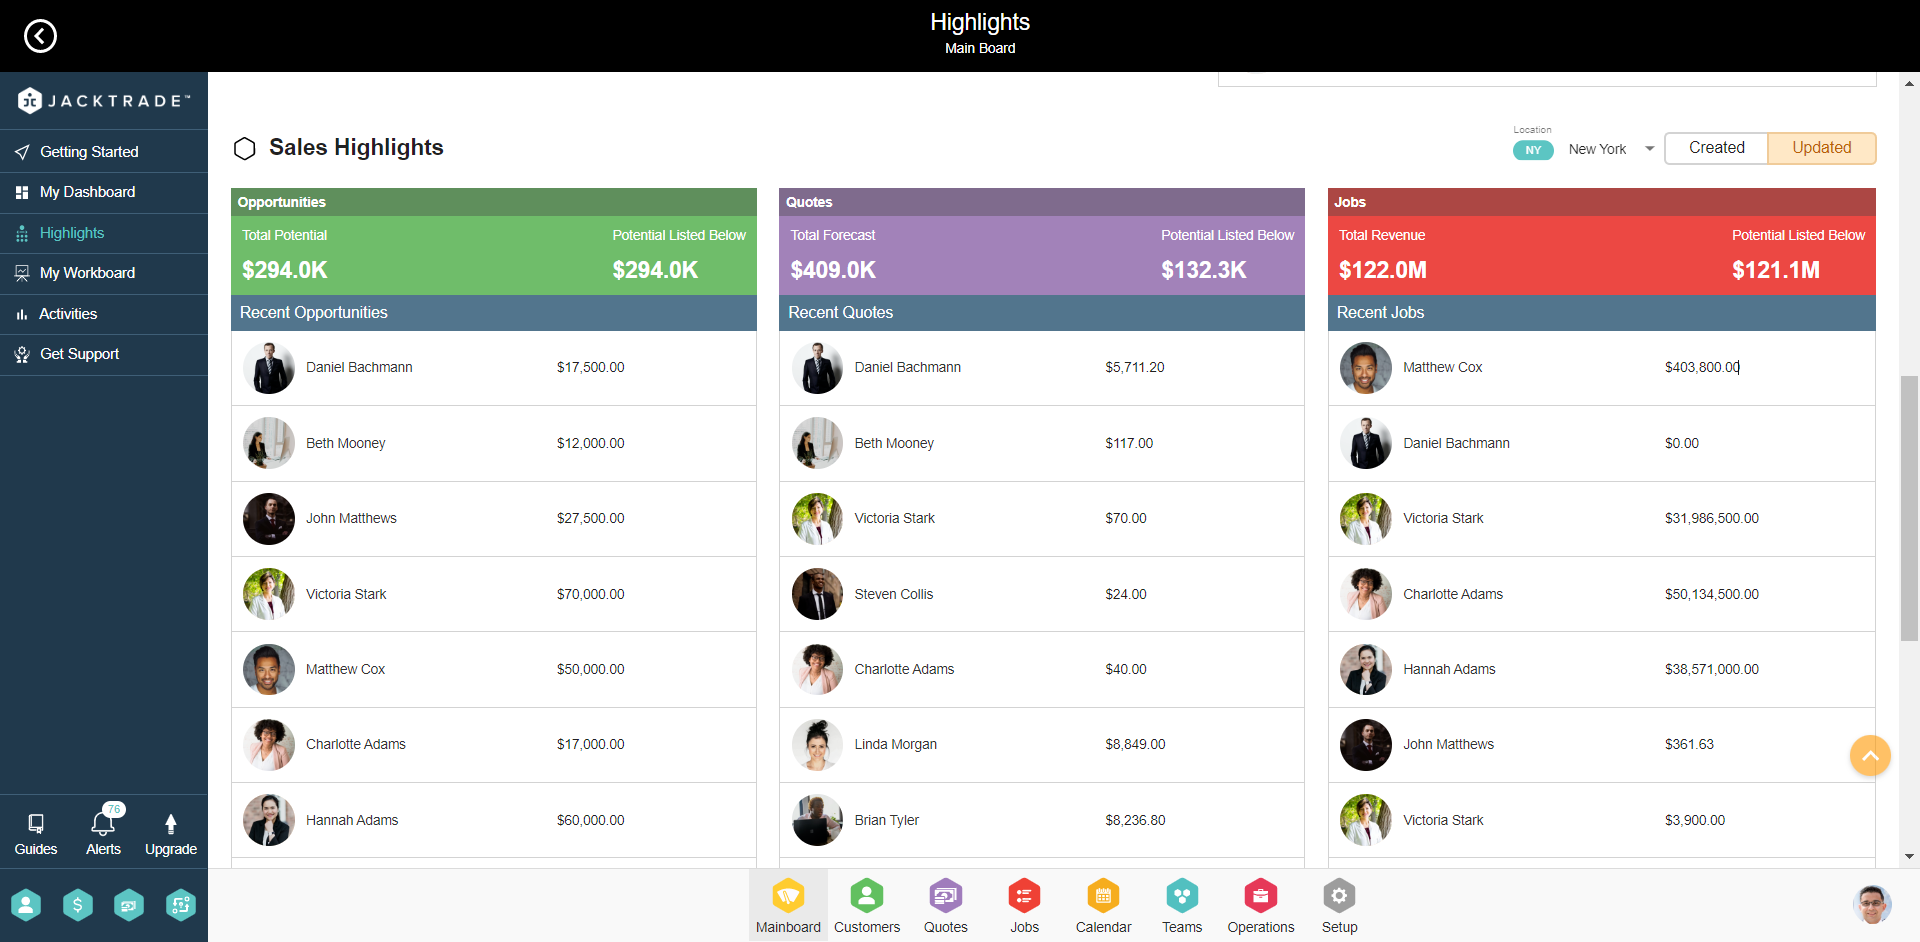
Sales Highlights
Sales highlight is an easy way to look at the sales cycles in your business. Sales highlights include the main three pillars of sales force automation - Opportunities, Quotes, and Jobs. Here you can see the top five list of recently added or updated Opportunities, Quotes, and Jobs.
This data can be filtered out based on 2 parameters -
- Created or Updated
- Business Location
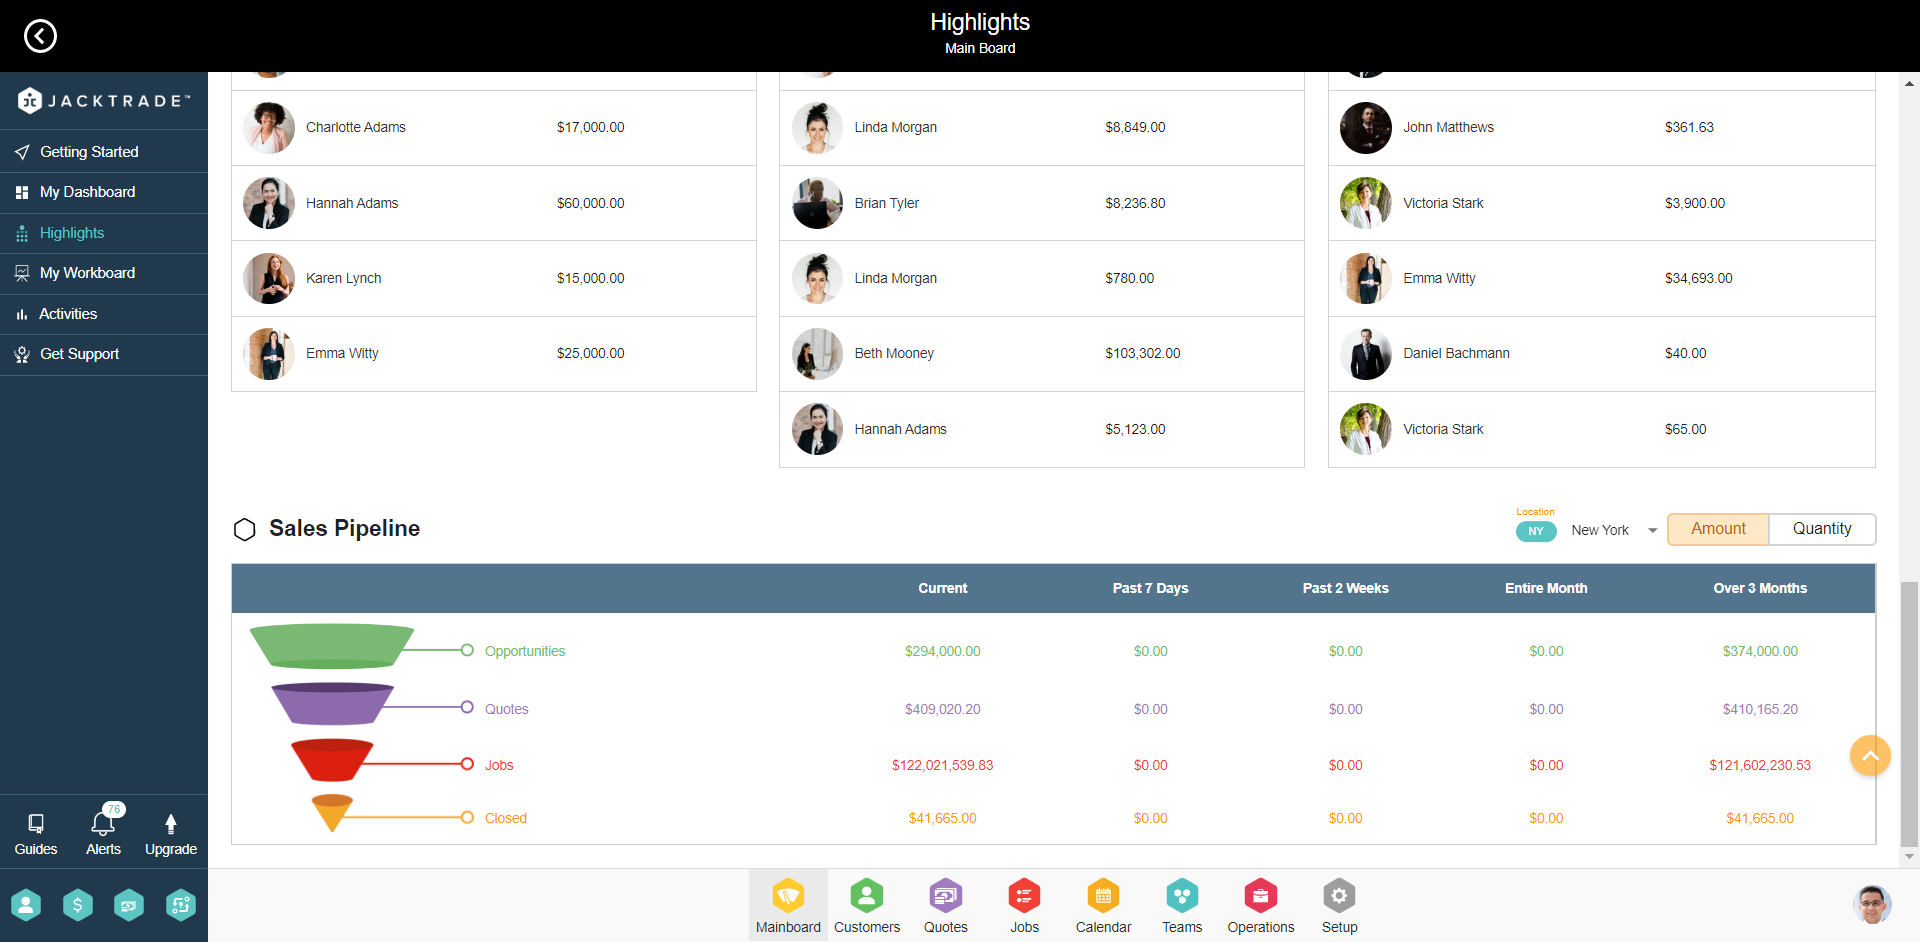
Sales Pipeline
The sales pipeline is the stage of converting leads into sales. It's a visual representation of different stages of the sales process like Opportunities, Quotes, Jobs, and Closed Jobs with statistics around it. The sales pipeline here shows statistics of the amount and quantity for the above-mentioned functions.
This data on the sales pipeline can be filtered out based on 2 parameters -
- Amount or Quantity
- Business Location